Microchallenge 02
Microchallenge 2 ~ Designing with Intelligences
Too Long Didn’t Read
In our second microchallenge, Carlotta and I continued developing our energy monitoring project. We focused on enhancing our AI chatbot “Dan” to assist with energy tracking and started building our own open-source energy monitor using Arduino. We successfully created a system where Dan can respond to energy usage queries via Telegram and even print energy-saving stickers. Our energy monitor prototype works but requires calibration for accurate readings. Moving forward, we’ll refine the hardware, develop a custom PCB, and involve volunteer testers for user feedback. Full details and code are in our GitHub repository.
Conversational Energy Tracking & Open Source Hardware
This microchallenge followed on from our first one a few weeks back. Carlotta and I partnered up together once again to continue developing our open energy monitoring project and put more of our focus into building our chatbot into a functional and useful assistant and companion. Paired with this, we started to build our own energy monitoring hardware based off arduino to create an easily accessible prototype that could be paired to our energy AI.
As before, we’ve documented the whole process in much more detail, as well as including all the code files and prototype schematics in a GitHub Repository which you can view by clicking the link below!
You can check out a video of our design process below! 👇
What was our goal?
After the first micro challenge we got talking about what ways we could push this open source device further and how the chatbot aspect would work.
The aim of this challenge was to use a form (really any kind) of intelligence to create a physical output.
i.e. turning sound waves into gcode usinng an AI that would move a robot, for example.
Knowing we wanted to keep developing our energy bot ‘Dan’ we knew had the first part figured out. However it was the second half of the challenge that was stumping us:
We had no idea what kind of physical output we could create from Dan.
We brainstormed and threw around a few ideas on what the physical output could be for challenge, which ranged from creating a daily report about how much energy you’ve used on a given day, printing lists of energy saving tips, or highlight what was consomuning the most energy in your life.
In the end we settled on raising awareness for the project and the issues we are working on.
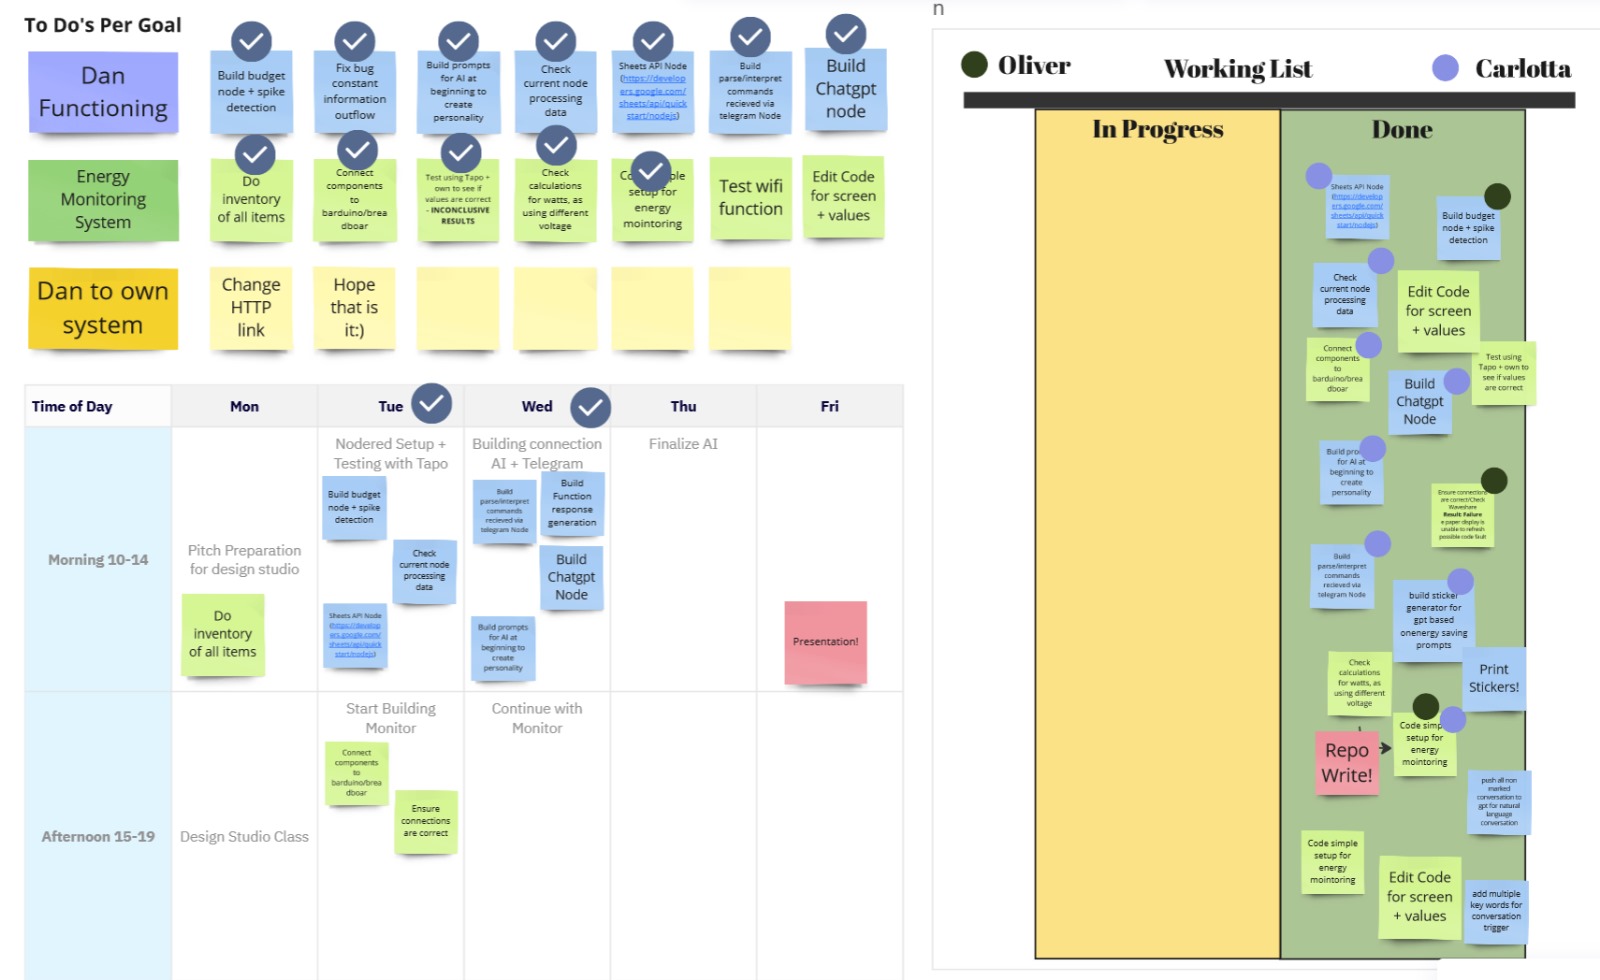
Making a plan
We created a plan for the week, evaluating our skills and divided our time equally between developing the AI Chatbot and building the energy monitor. We created this all in our shared miro board which allowed us to divide and conquer the tasks and challenges for the week.
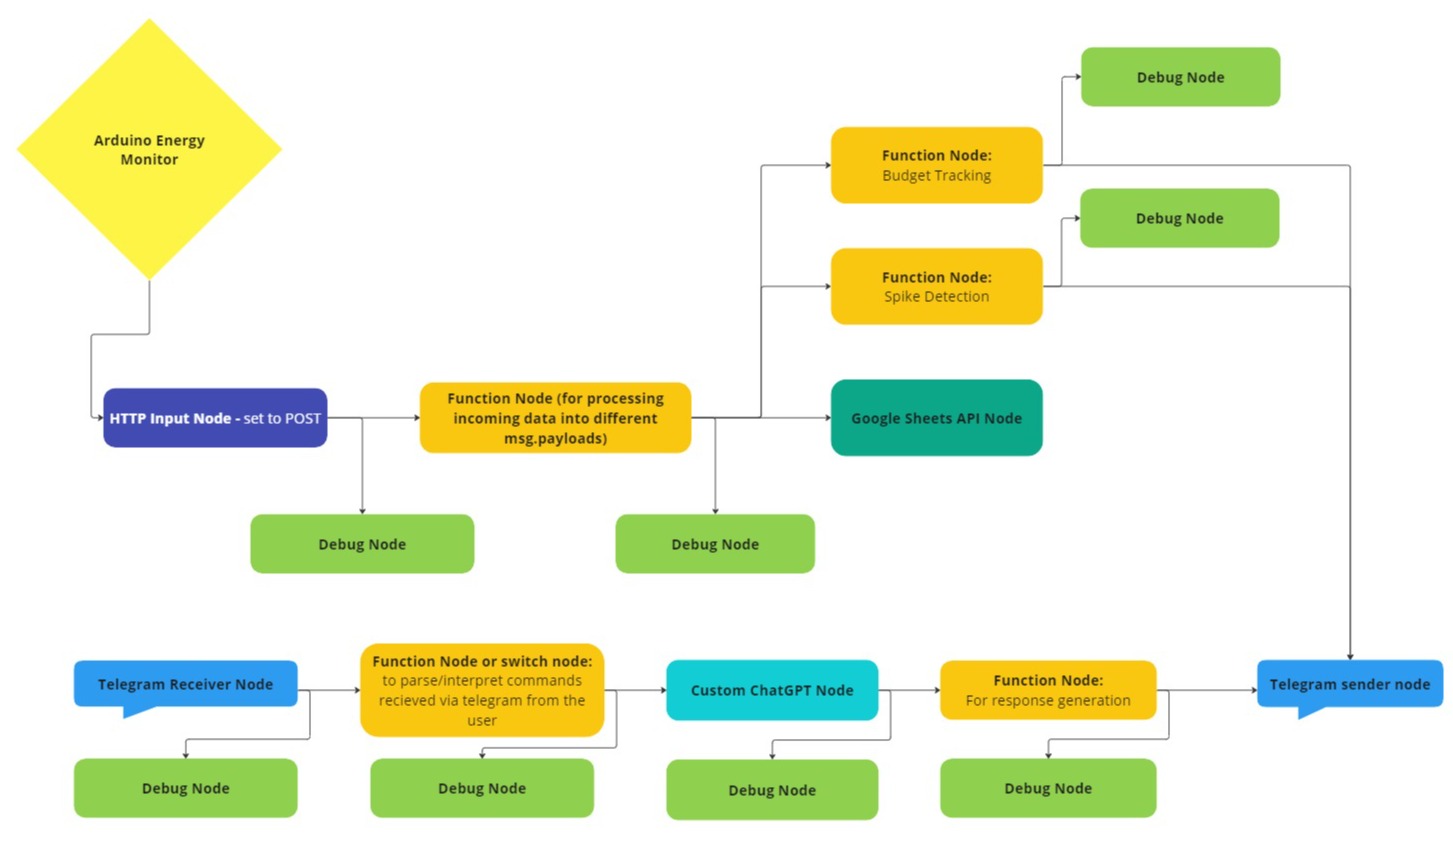
The logic of Information
To turn ‘Dan’ into a properly functioning energy assistant we had to take some time to understand just what exactly we were trying to build and how each of the components within the information flow would work. Combing through the documentation on Node-Red’s own site, stack overflow and Chat-GPT (for coding assitance if it became necessary, which was most of the time) to figure out how we could build out our Node-Red flow to support our needs even further.
We were able to use a google sheets API node to connect to a spreadsheet database we’d made to log energy consumption data that our chatbot could access for context specific information. To make it possible to have an actual coherent conversation with ‘Dan’ we used a Chat GPT API node that allowed us to send information after a specifc prompt to the large language model, where it would process that information and respond with a short and (hopefully) accurate response about your energy consumption habits, this node was also able to read the contextual knoweldge from the spreadsheet database as well.
These nodes had already been created by others who had wanted to explore these tecnologies themselves, which was great as it gave us some legs to stand on at the start of this challenge.
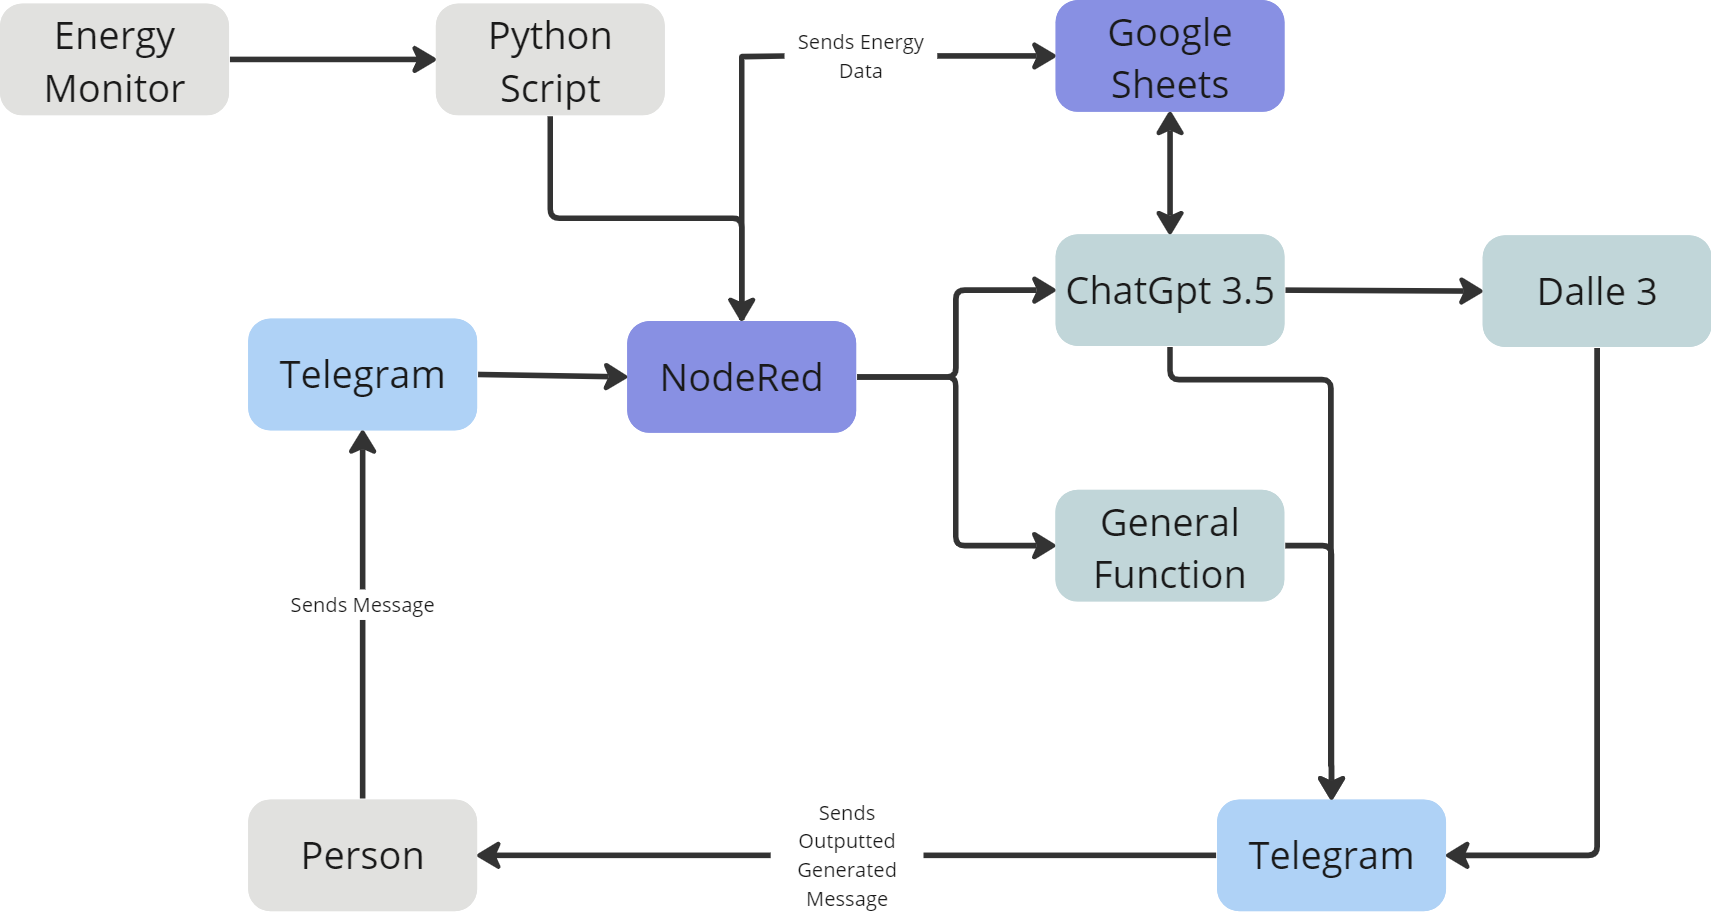
The Outcome
Dan the Energy Bot
Dan in it’s current form takes a variety of input queries coming in through Telegram from the us (the users) and tries to have a conversation with us. While doing this, it is also constantly logging consumption data from the energy monitoring hardware itself in the google sheets database we’ve created for it.
This database gives ‘Dan’ much better context on what exactly is consuming energy in the home and allows it to give you much better advice on your consumption habits.
Right now there are still a few bugs to work out but as of the time of this writing, it’s possible to have a fully contextually aware conversation with ‘Dan’ about all things energy related.
You can check out how we interact with ‘Dan’ in the video below! 👇
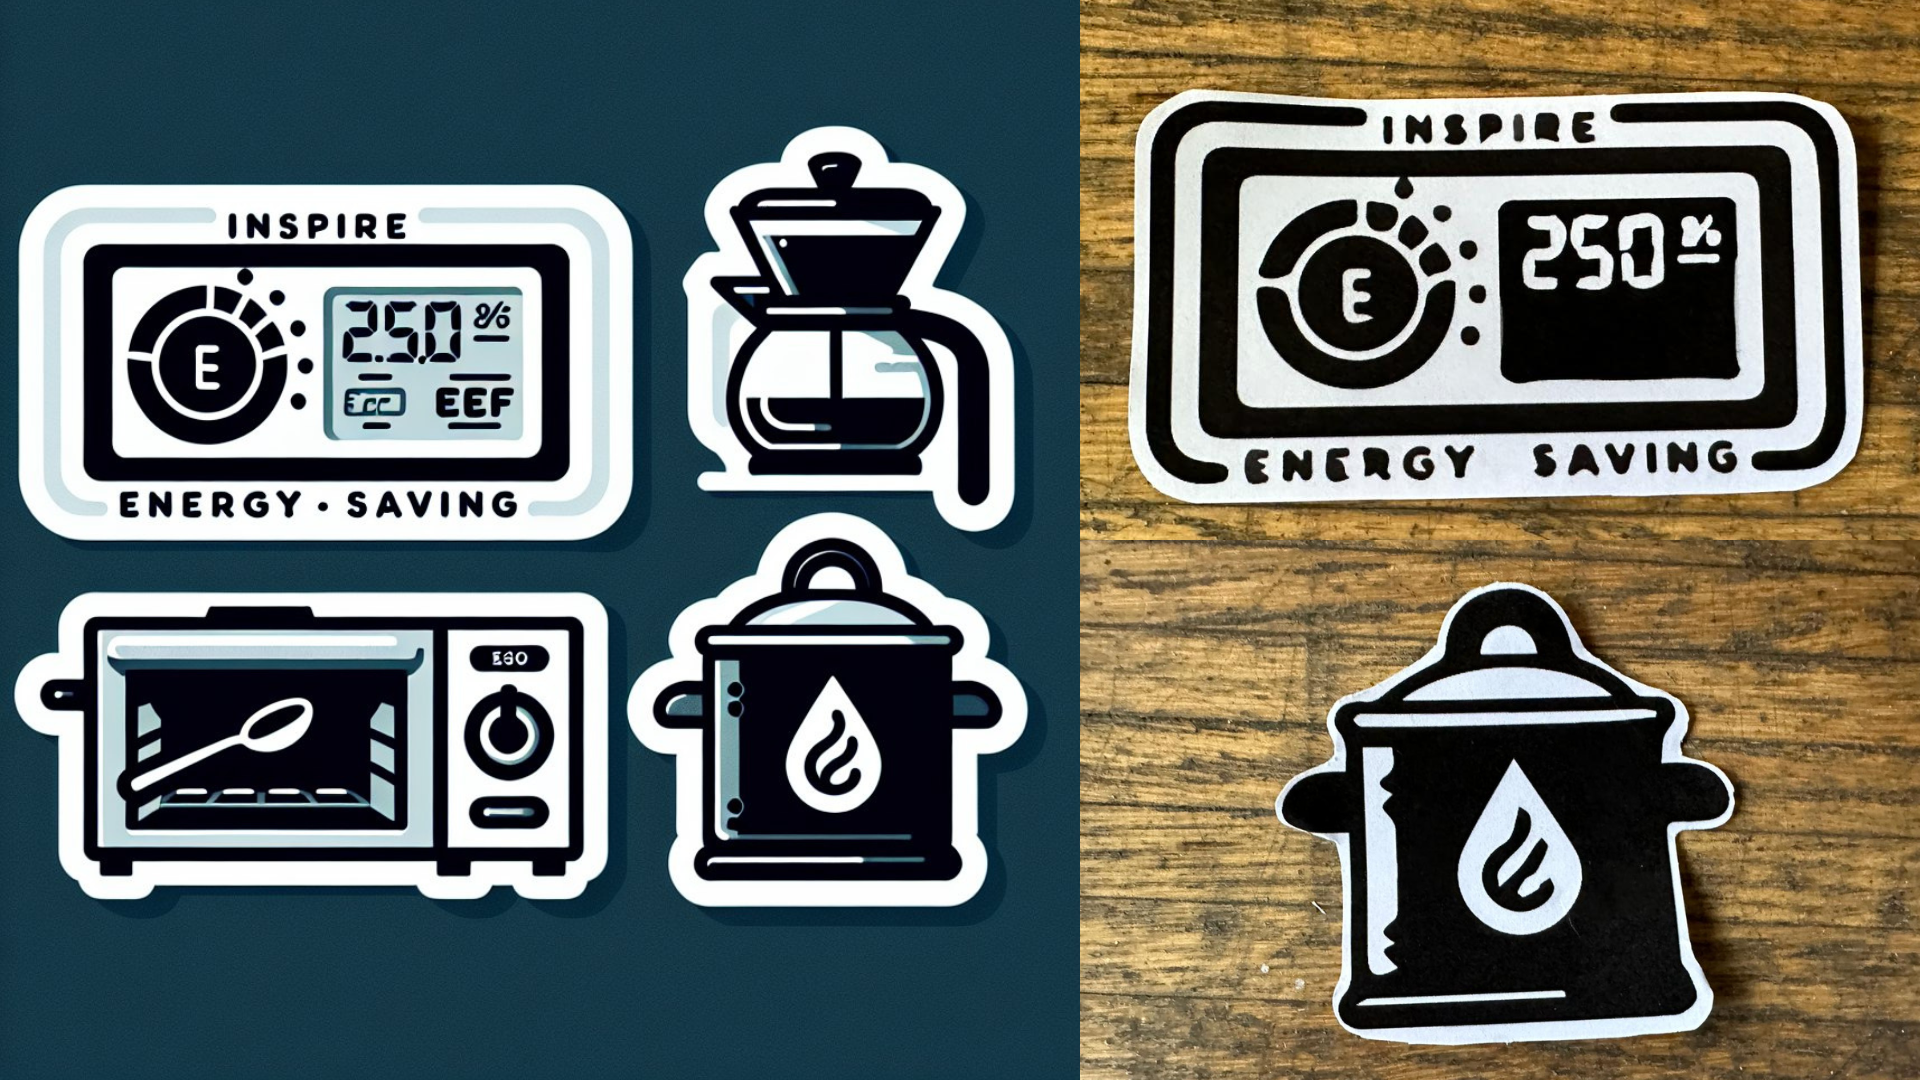
To fulfill one of the tasks for this microchallenge, Dan will also provide you with a series of printable stickers based on the advice you recieve, which can be used both as a personal reminder to take part in better energy practices but also as a label for what appliances use more energy than others and if they might need changing or not.
Right now we aren’t sure if this feature will stick around, but right now it’s a good bit of fun, and helps engage people in a friendlier and approachable way.
Our Energy Monitor
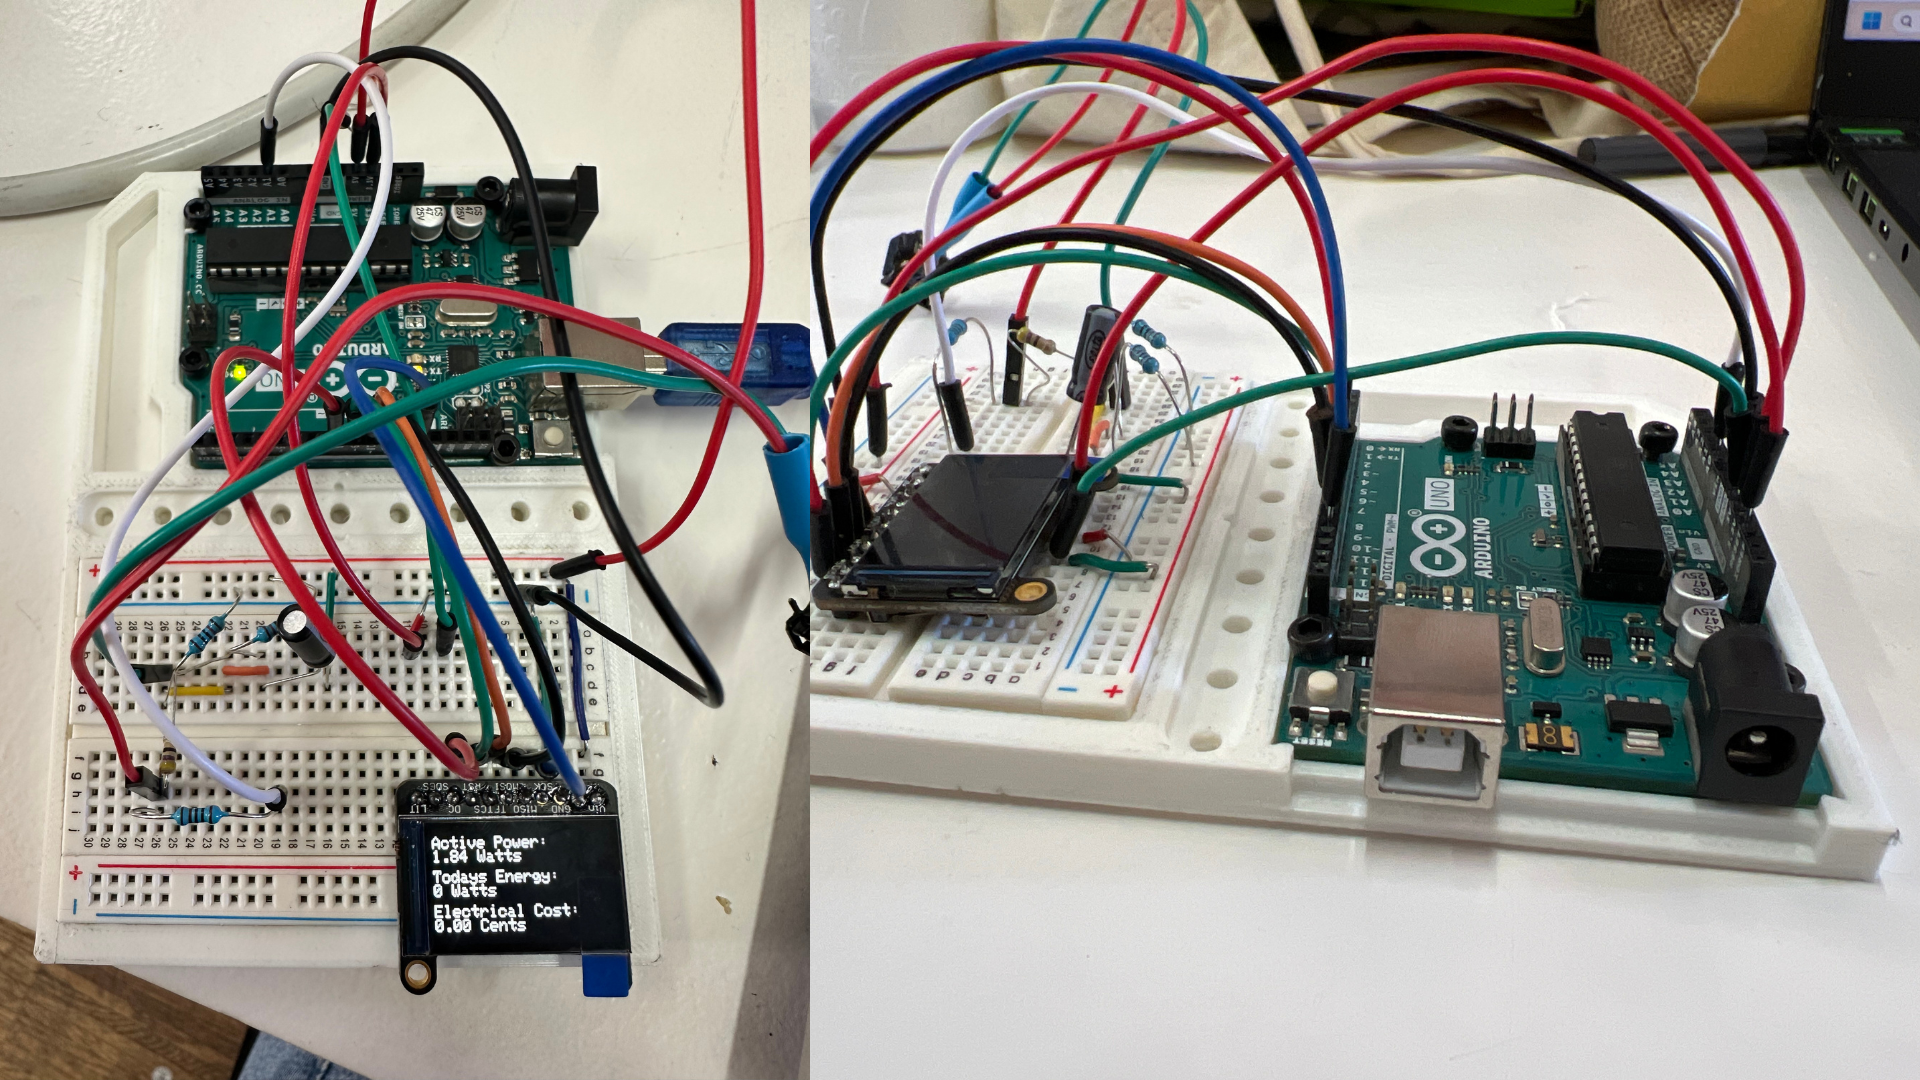
At the current stage of our research and then end of this challenge we have a fully functioning energy monitor. Like we originally wanted, it’s based off of ardunio and other components we were able to source locally.
While it works and is able to read the energy data coming through a extension lead we’ve connected it to, there is a small issue with some of the readings it makes. Our voltage and current readings are slightly too high, disrupting and reducing the accuracy of the results.
Thanks to one of professors, we quickly learned that most of our data was a bit off because we were trying to measure the current in 3 wires instead of just one, as the current transformers we were using were better suited to one than 3, once we’d corrected this problem our readings started to look a whole lot more accurate than before, but definitely still require some tweaking to get them fully dialed in.
This is already raising a lot of questions for me, for instance: if we want many people to use these devices are they each going to have to calibrate it themselves? and is that going to put people off from wanting to use it? I’m not sure yet.
Hopefully with enough modifications our monitor will be able to clip into your breaker box and watch all the energy being consumed in your house without needing many different interconnected plugs in each socket.
We’ve now started work on a second version of the monitor that uses a different ardunio based board (called the Barduino 4.0 developed by the excellent people here at Fablab) which includes an esp-32 chip, this is important as it allows us to send consumption data dirrectly to our node red flow and into our AI. This lets us reduce the number of components we need to fully develop this project!
You can watch a video of our energy monitor here below 👇
Final Thoughts and Reflections on this week
This microchallenge has been a lot of fun, we’ve made significant progress in our research into measuring and understanding energy consumption, as well as how we can combine this information with big data technologies like AI in a collaborative and conversational way.
We made even more progress in understanding our skills in coding and basic programming using tools like Node-Red, coding with Javascript and Arduino as well as understanding how to adapt existing state of the art technologies through different API calls.
It was nice this time around do a bit of hardware development, even if it was just a basic circuit to understand the real world aspects of our research, which was a welcome change to just working on software as we did in the previous microchallenge.
We can definitely feel ourselves adapting as designers, turning into hybrid designers from pure product designers we were before, this an exciting area for both of us as we’ve been able to explore a range of interests we’ve had that that we might otherwise not have been able to engage with as much in the past.
Moving forward we’d like to continue working on this energy monitor prototype, developing the circuit further to use a different microcontroller with an integrated ESP332 moudule, which would allow us to consolidate hardware into a mich smaller package, as well as publish the recieved energy information to our Node-Red Dashboard and our friendly energybot Dan.
Building on this we’d like to create a custom PCB that integrates all the individual components we’ve used onto one board, and do a bit of old fanished product design to create an appealing and usable casing that would faciliate an intuitive user experience and actually look like a consumer facing product.
We plan to develop a few prototypes that we could send to some volunteer Alpha testers, where we could then engage with our community through user led design feedback to better improve both Dan the energy bot and our energy monitor, to be able to investigate further our research idea of reducing consumption without lowering the quality of life of the people that use our systems.