Design Studio 02.01
Understanding ways of drifting, framing project goals and planning interventions
Too Long Didn’t Read
In our first design studio class of the second term, we explored “ways of drifting” to understand how our research interests evolve. Inspired by my early work on energy consumption, I teamed up with Carlotta to investigate how we can redefine our relationship with energy. We used models like the Two Loops Framework and intervention strategies to map our goals. Our first intervention involved using smart plugs and a comprehensive energy tracker to monitor our consumption. We aim to develop tools that help people reduce energy consumption without compromising their quality of life.
In our first design studio class of the second term we were introduced to the concept of “ways of drifting”. Which is a method for understanding how our research and project interests change over time nad a way to help us re-evaulate where our interests lie. After the first Design Dialogues event back in December, I’ve wanted to build off some of the (very) early research I did into energy consumption back in the first term when I did my 24 hour 2000 watt challenge for the “Living with your own ideas” module.
Ways of Drifting
In our first design studio class of the second term, we were introduced to the concept of “ways of drifting”, which is a method for understanding how our research and project interests change over time and a way to help us re-evaluate where our interests lie. After the first Design Dialogues event back in December, I’ve wanted to build off some of the (very) early research I did into energy consumption back in the first term when I did my 24-hour 2000-watt challenge for the “Living with your own ideas” module.
For now, my interests have narrowed down to the field of energy, exploring how we can redefine our relationship to energy. Framed through the lens of transition design and steering towards a more solarpunk future to create more regenerative societies and take advantage of the post big-data world we are entering into to start to develop an alternative present that can move one step closer to a more solarpunk version of the future.
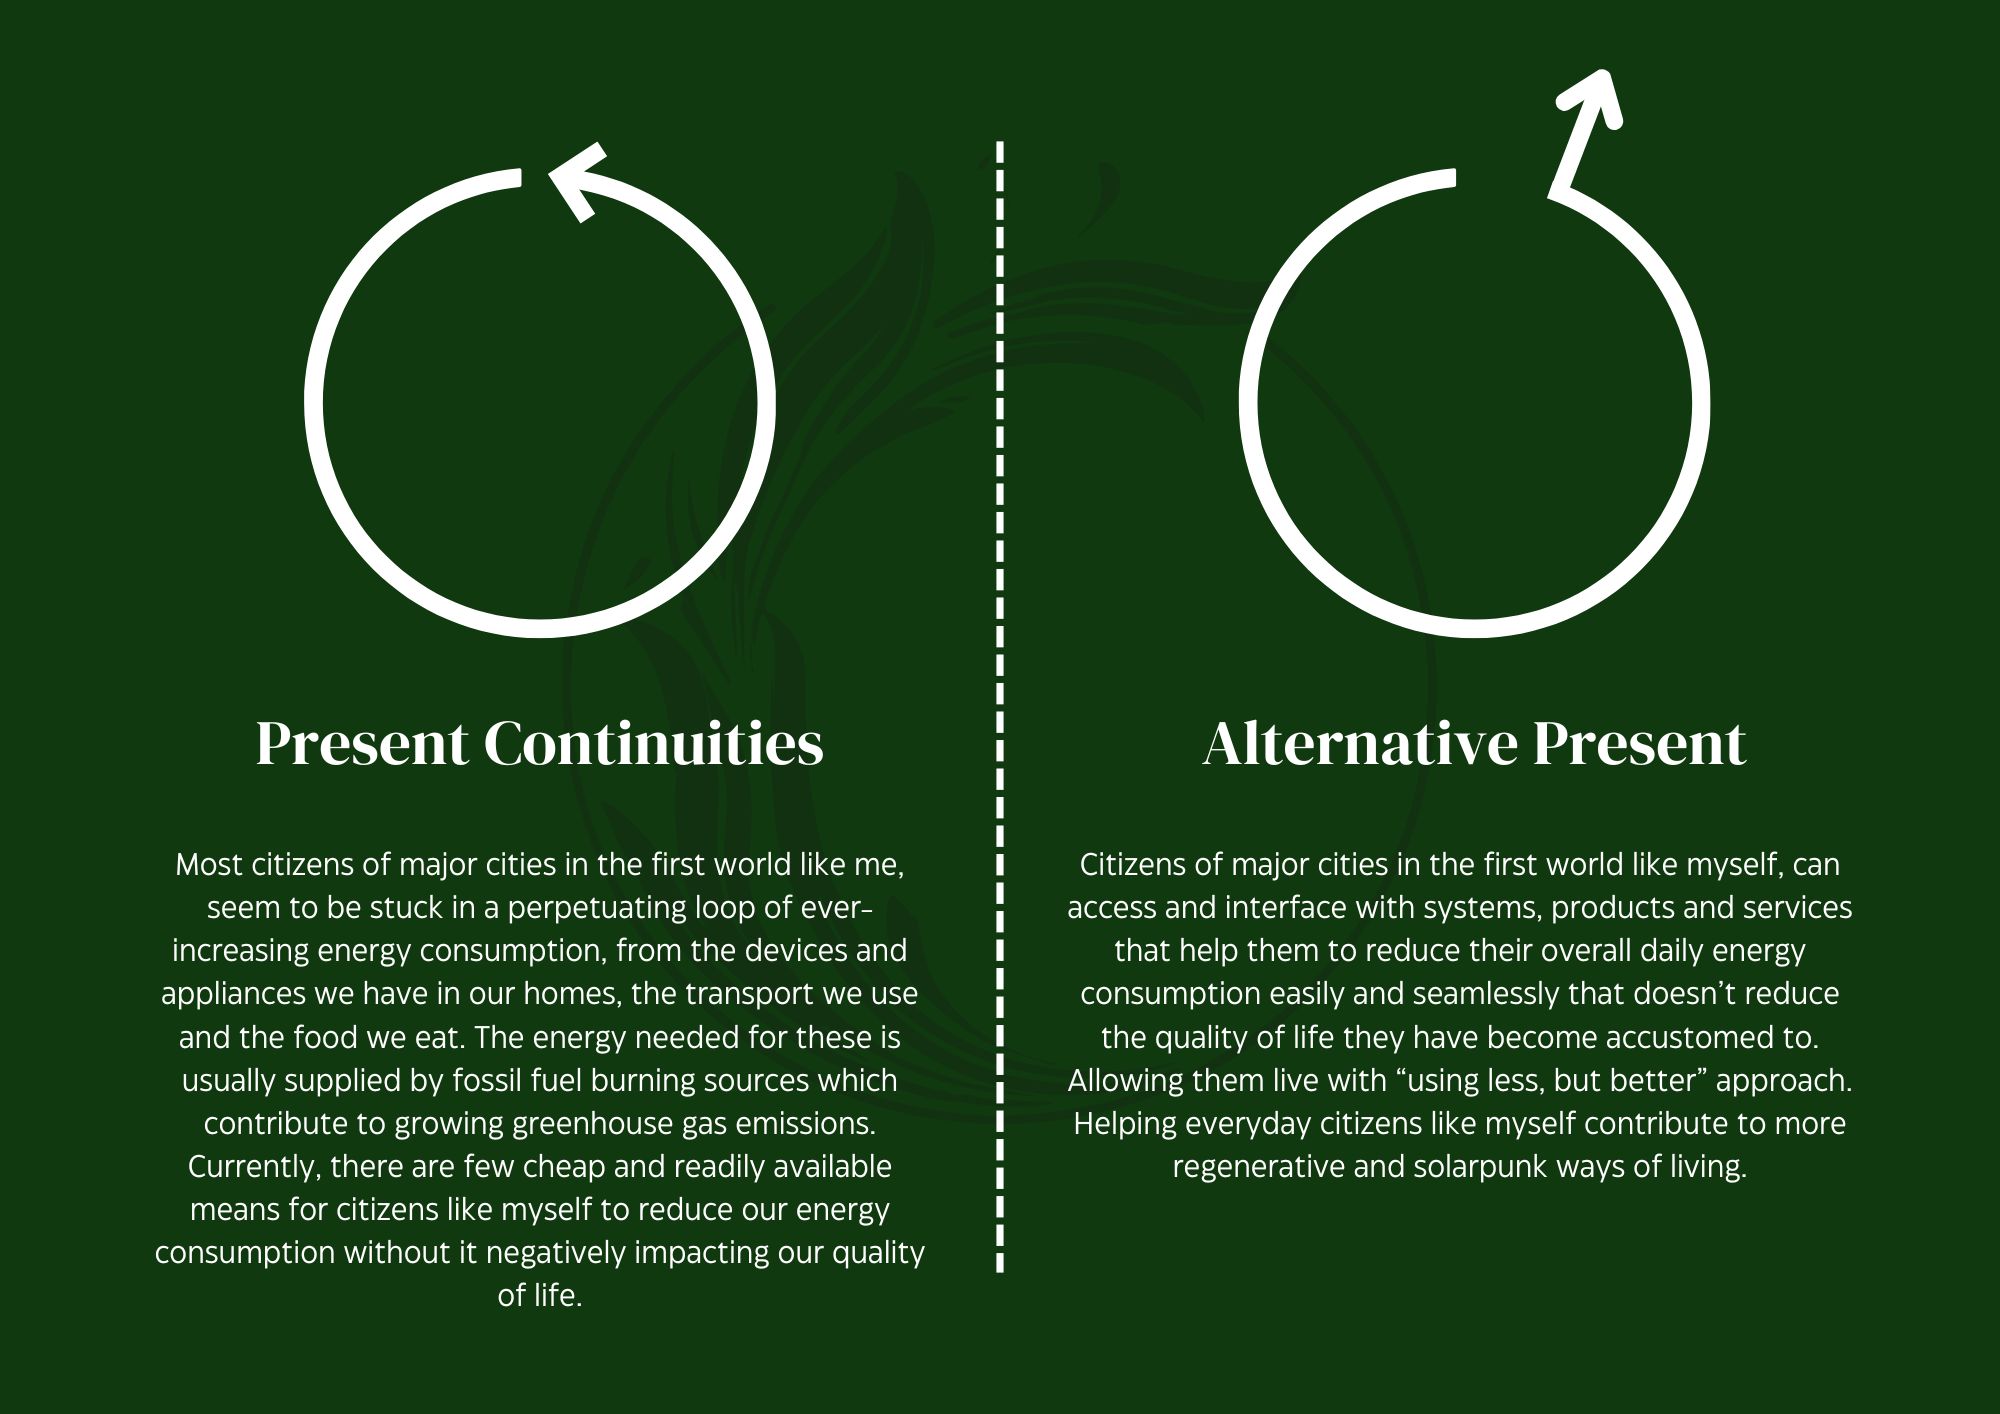
Present Continuities and Creating Alternative Presents
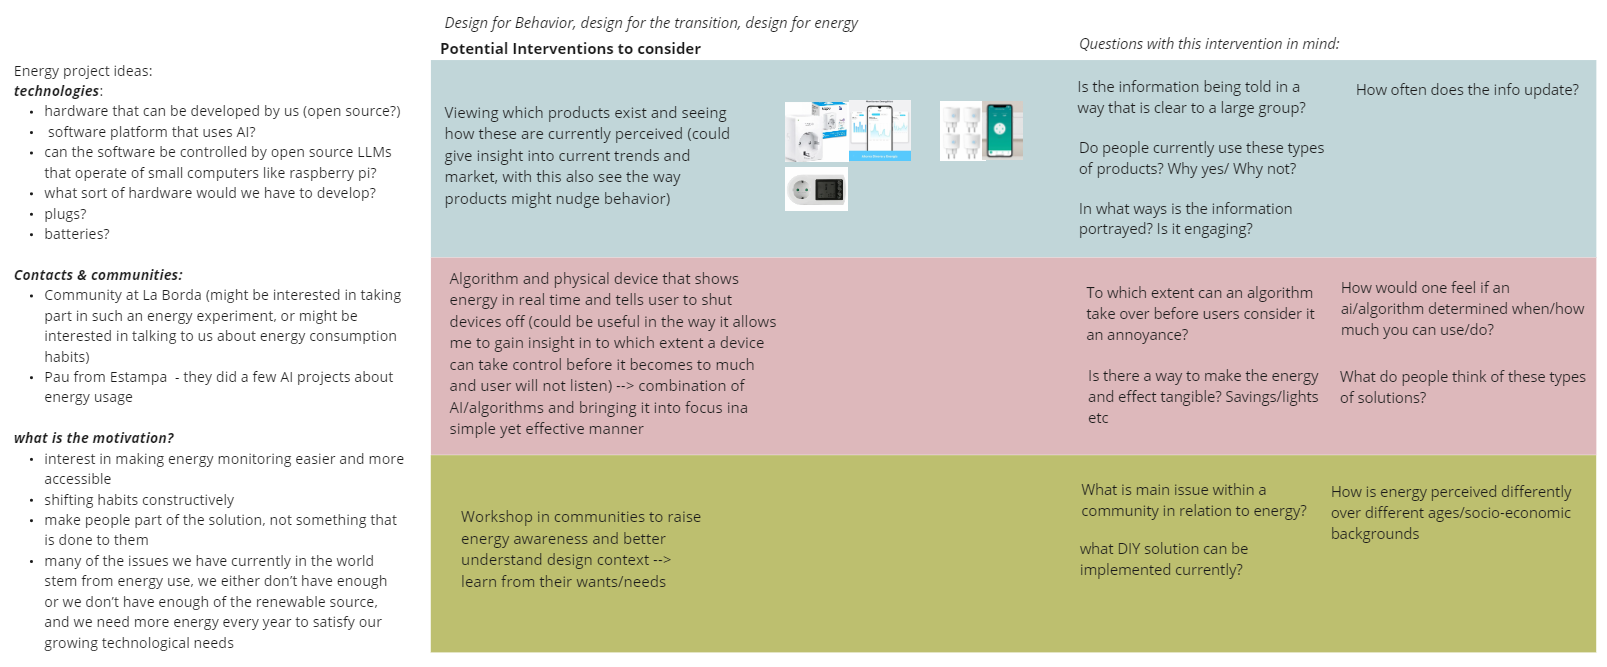
At the start of the class, we were introduced to various methods for charting the ways our interests have drifted. They showed us how to turn these drifting currents into actionable understandings and these disparate thoughts, ideas and concepts into potential problem statements/questions we can explore by creating alternative presents.
The method that most stood out to me was the current loop and inflexion point model. A method that uses identifying weak signals that can be taken advantage of to move the current system (or loop in this case) into a new system, shifting the whole system to a new (and hopefully improved) paradigm.
For me, this paired really well with a framework I’ve recently discovered called the Two Loops Framework. Developed by the Berkana Institute, it illustrates how dominant systems and emergent systems coexist in a series of loops in the form of a sine wave, and how different actors fit within the model. It’s a methodology that allows you to frame your projects within these areas, either in the dominant system, the emergent system or the period of transition in between these loops.
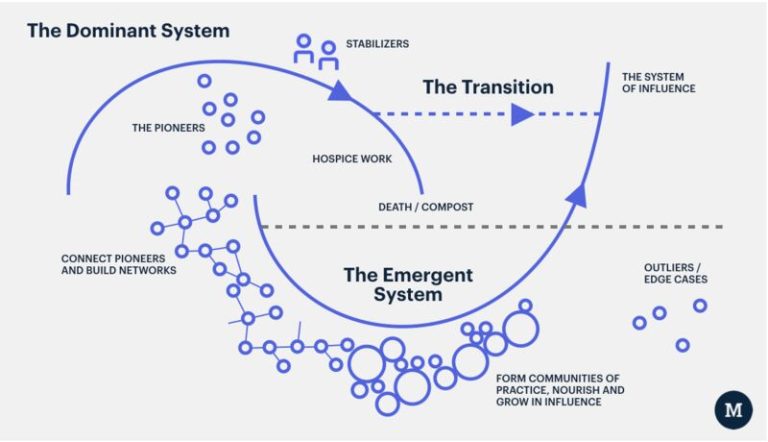
This framework is something that really spoke to me. I think it’s a really useful way of positioning different types of projects, especially in the field of design. Existing either as pioneers in the dominant system, trying to create new technologies that move us away from it, or as new technologies that exist to help take care of the dominant system as it starts to die down as a newly emerging system takes over. Or projects can exist in the transition period, where we can create systems, policies, and products that exist to transition us away from the dominant system and into the new emergent system.
I think it’s something really interesting and exciting, and a great way of being able to frame the projects we take part in on our course as we head into the second term.
Combined interests, and first Interventions
I was having a discussion with one of my coursemates, Carlotta, and we discovered that we had a lot of similar interests. We were both interested in energy, understanding our relationships with it and how we can redefine these relationships through habit change, products, services, and policy change.
After a series of talks between us in which we outlined our research interests even further, we’ve decided to explore these questions together through a series of interventions that will potentially culminate in a larger thesis project.
We created a Miro board where we could share our ideas, our individual goals for the project and where we wanted it to. This Miro board is constantly updated as we learn more, and further refine and define the project research.
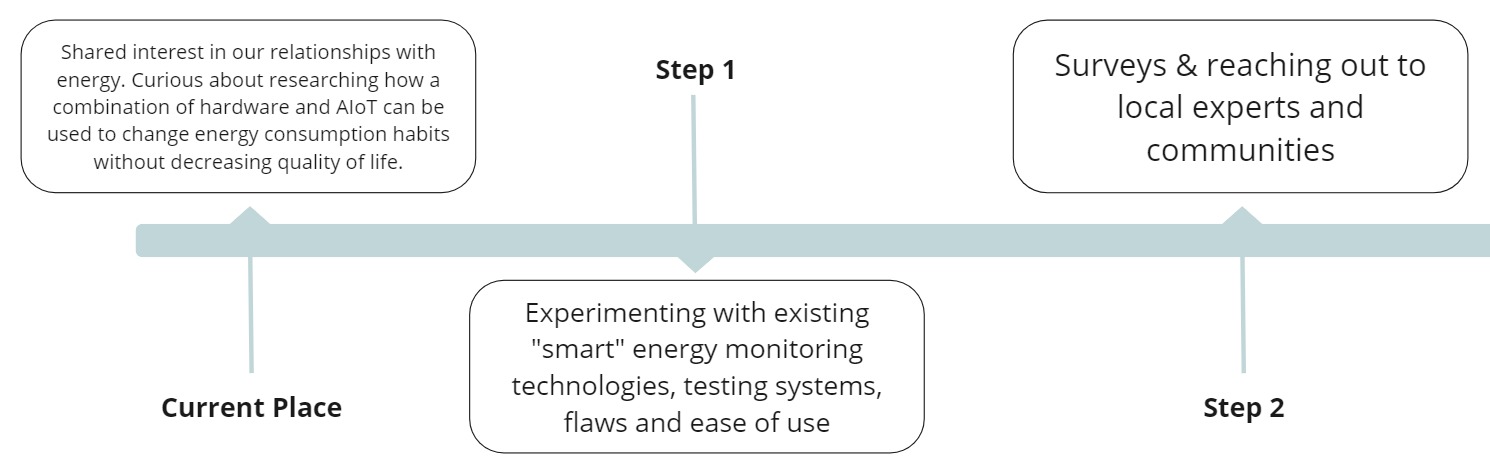
We also built ourselves a project timeline, outlining a rough schedule we want to try and follow for a series of interventions and research projects that can help us further explore this topic.
First intervention ~ Consumption Monitoring & Habit Change
For our first intervention, we decided to explore the idea of energy consumption and understanding where the state of the art is right now in terms of energy consumption tracking, and how we can experience that ourselves through first-person perspective learning.
We’d bought some smart plugs from TP-Link and used them to connect up our homes to monitor our energy usage. We compared our consumption and habits, mapping how they changed now that we could see in a tangible way just how much we were consuming.
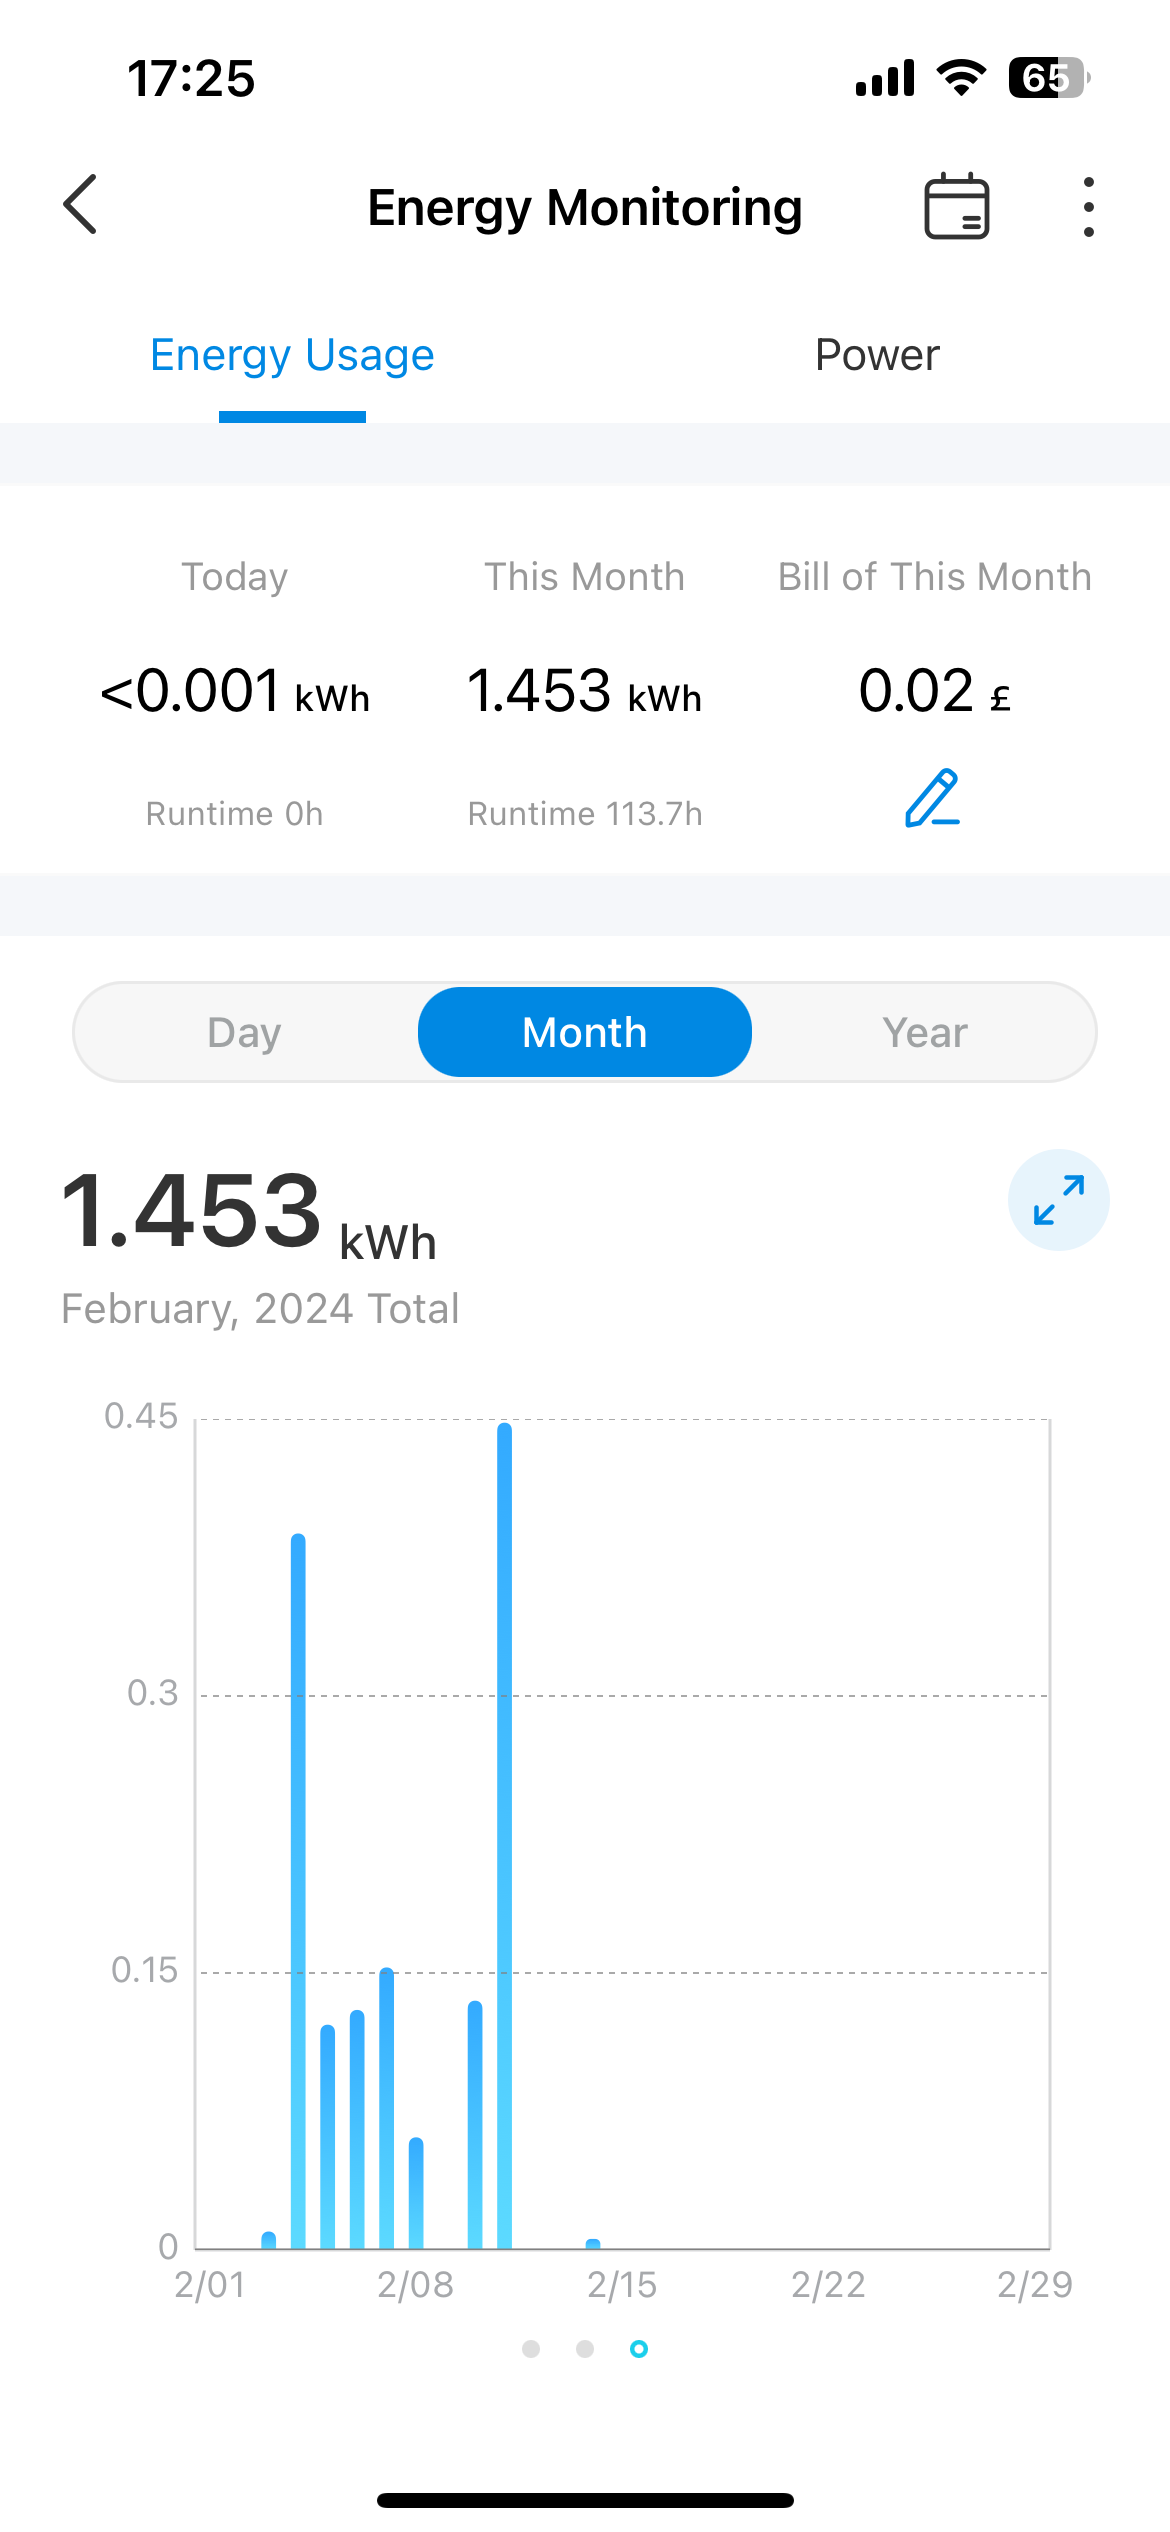
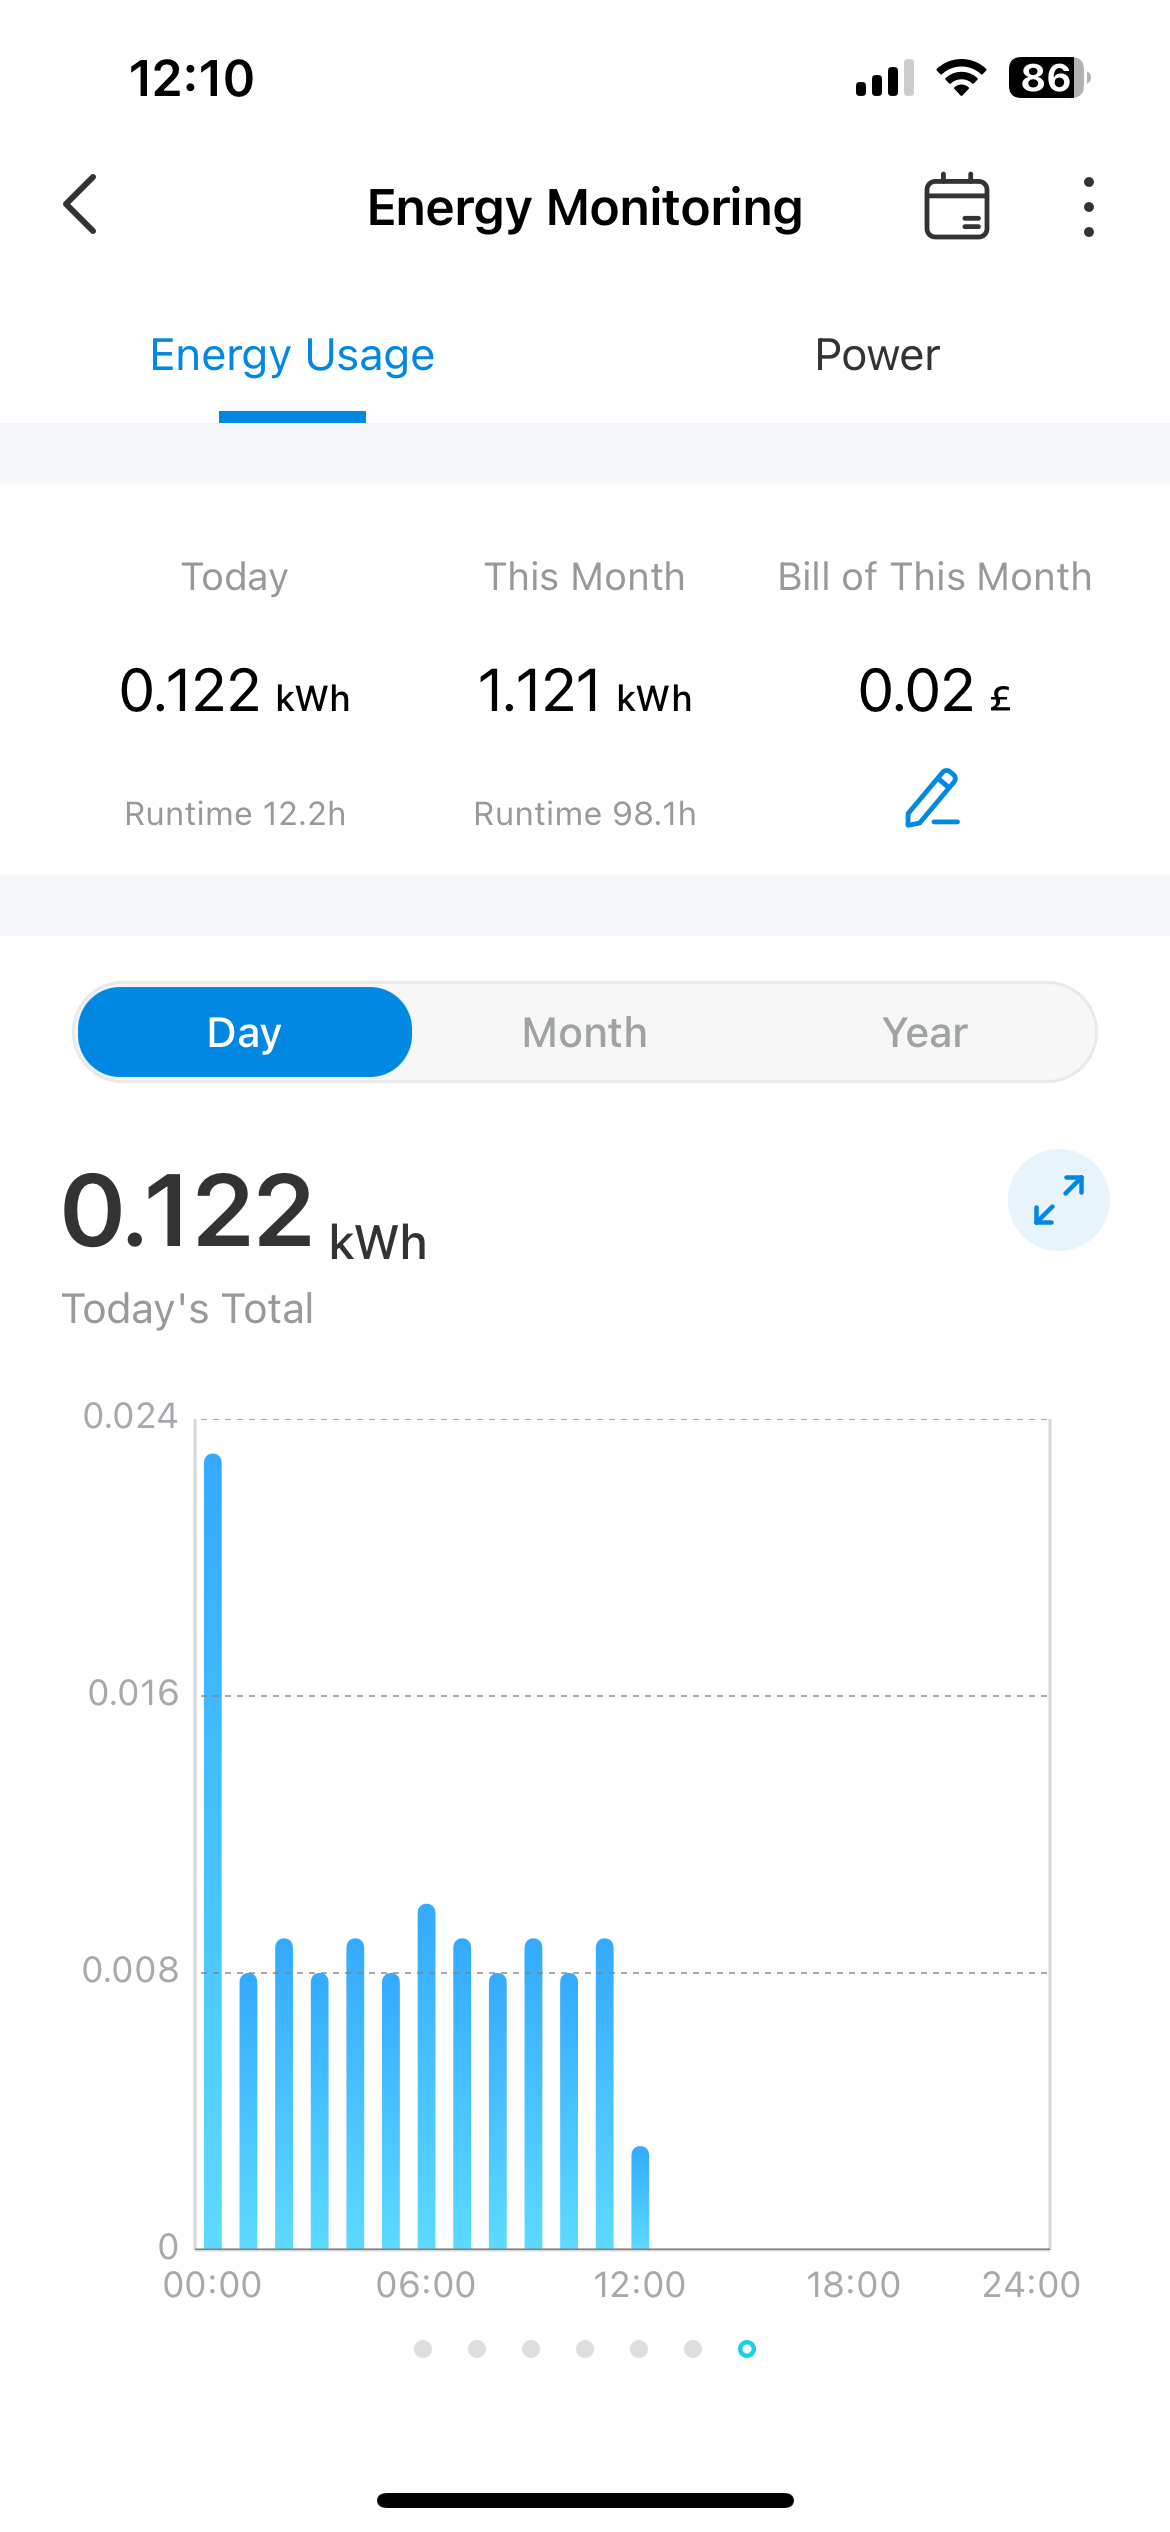
However, we quickly realized that this wasn’t enough to be able to be able to create enough of a big picture about our total consumption.
2,000-watt Tracker
We then decided to further explore the idea of the 2,000 Watt Society, and how we could try and reduce our energy consumption as much as possible to get closer towards, at or below 2,000 watts of energy usage a day for a week. To do this, we realized we needed to build a comprehensive spreadsheet tracker of all our energy consumption.
How it works:
The spreadsheet has a few different sheets, a home view where your total consumption is displayed, a sheet for the home and all it’s appliances, transport and food. Each one is split into several columns for categories such as wattage, consumption, time used, grams eaten etc. You can edit the columns for wattage per hour if you know it for your particular appliance, mode of transport or food, and if you don’t there are pre-set values based off of averages to keep you covered. Then as you go about your day, you fill in the usage column with how long you’ve been using that particular item, or how many grams of a particular food you’ve eaten. The total energy consumption for each item is automatically updated to reflect these changes and logged on a pie chart on the home page to make it easy to understand. Each night, the pie charts are saved to a location of your choosing through a custom script, allowing you to have a tangible record of your total energy consumption every day. Then in the morning you reset the usage column of each category and begin again.
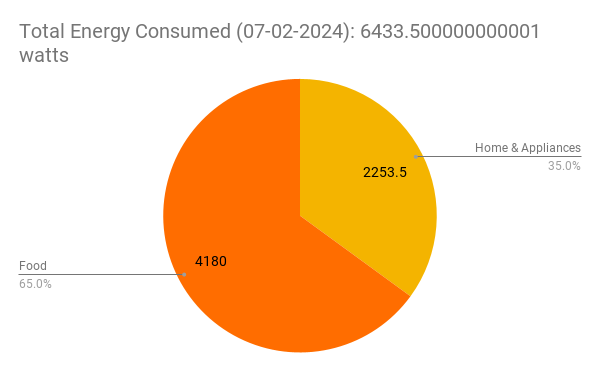
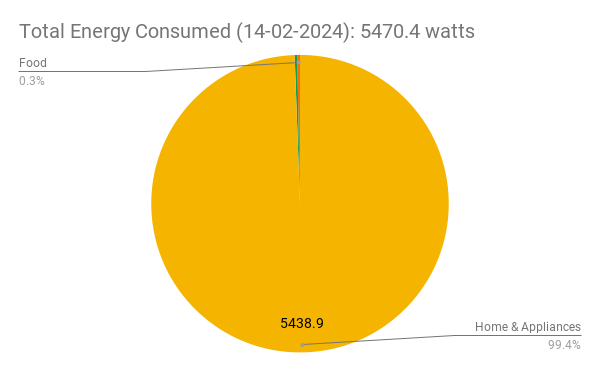
This so far has proved to be incredibly useful and very eye-opening. We’ve discovered that both of us, use about 8,000 watts of electricity a day (which is about the average that most people in Europe use) as watts of energy consumption isn’t just the electricity we use, but it’s also the energy used in transport and what goes into producing all the food that we eat.
Watts of energy consumption isn’t just the electricity we use, but it’s also the energy used in transport and what goes into producing all the food that we eat.
We’ve discovered a lot of things that require us to do so much more work than we expected to measure our total energy consumption. As it currently stands, trying to monitor all the energy you consume in a day is a complete headache, and if there aren’t easier ways to do it, we’ll likely continue as we are.
If you are interested in checking out the spreadsheet for yourself, and the scripts we’ve created to log data every night, you can check it out by clicking the button below, if you find it useful, or if you have suggestions please leave a comment!👇
Towards an Alternative Present
Throughout the coming interventions, we want to explore this future and hopefully develop something that allows us to create an alternative present where we’re able to understand our energy consumption a lot better and in turn create a space for people to start to slowly reduce their energy consumption without reducing their quality of life.
Energy Consumption Weak Signals
Energy consumption is a Weak Signal that is quickly becoming one of the next big trends coming into play as we move away from fossil fuels along with our reliance on other nations to supply our energy.
As countries start to reshore as much of their energy supplies as they can through increasing uses of renewables, how we consume energy will start to take centre stage as we develop more and more efficient technologies and put policies in place to try and reduce our energy consumption.
This is going to be an exciting field to explore over the next couple of weeks through interventions that start to push the boundaries of what we can explore in our current present to try and exist in the transition space between the dominant system and the emergent one.