Microchallenge 01
Microchallenge 1 ~ Sensing the World
Too Long Didn’t Read
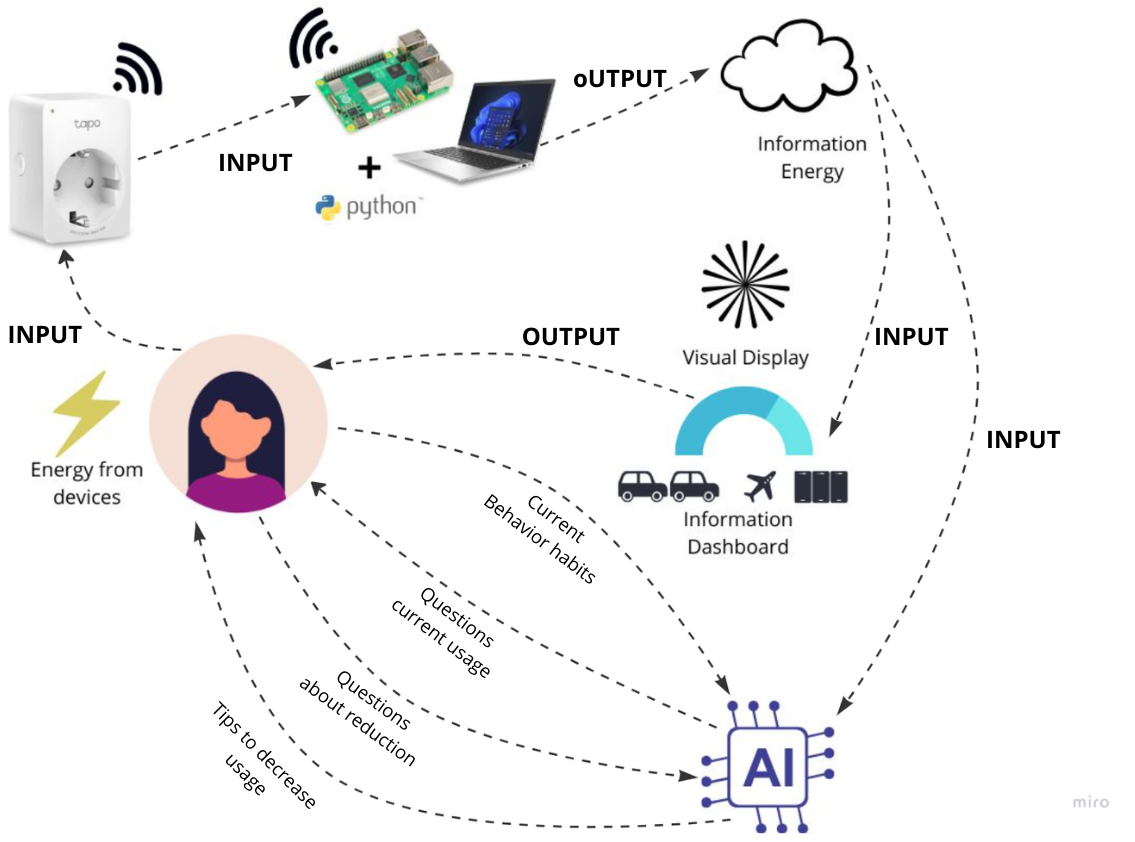
In the first microchallenge, my classmate Carlotta and I explored creating intuitive tools for energy management and consumption visualization. We developed software using Tapo smart plugs to monitor energy use and display it via a Python script and P5.js for a visually appealing dashboard. We also created “Dan the Energy Bot,” a Telegram bot to provide real-time energy consumption data through text messages. While challenging, the project was rewarding, and we aim to further develop a conversational AI to assist with personalized energy management.
This was our first week long micro challenge, an intense week where we combine all the knowledge we’ve been exposed to and practical skills we’ve been learning to create prototypes that can further serve to help us in the explorations of our various interventions.
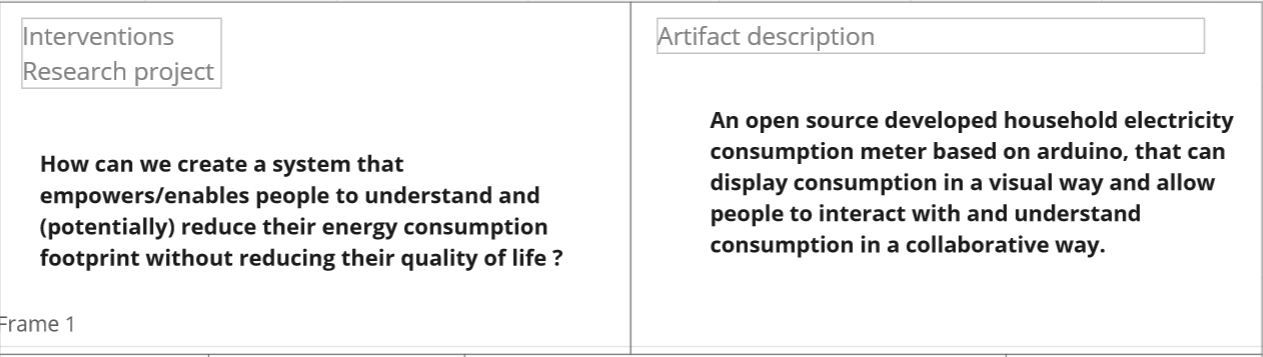
For this challenge, my classmate Carlotta and I paired up together to explore how we could create different artefacts that could help with understanding energy management, consumption and eventually reduction which fit nicely into our overarching thesis research area, and we counted it towards our second intervention in this space.
What did we do?
We had decided to see if we could build a more open and intuitive way for energy consumption management. We wanted to explore how we could better create tools to visualise how much energy we were consuming at home with the aim of trying to reduce some of the brain bandwidth strain when thinking about just how much energy we use in a day.
All of the information, code, images and schematics we developed can be found in our GitHub repository linked blow! 👇
Finding common ground
As Carlotta and I already knew we shared the same interests, but not necessarily the exact same goals for the research, we plotted out all the things we wanted to explore over the course of the week to see if we could find overlap that would allow us to create something that we were both really interested in. Using a Miro board and a Venn diagram, we laid everything that had thought of that might want to explore.
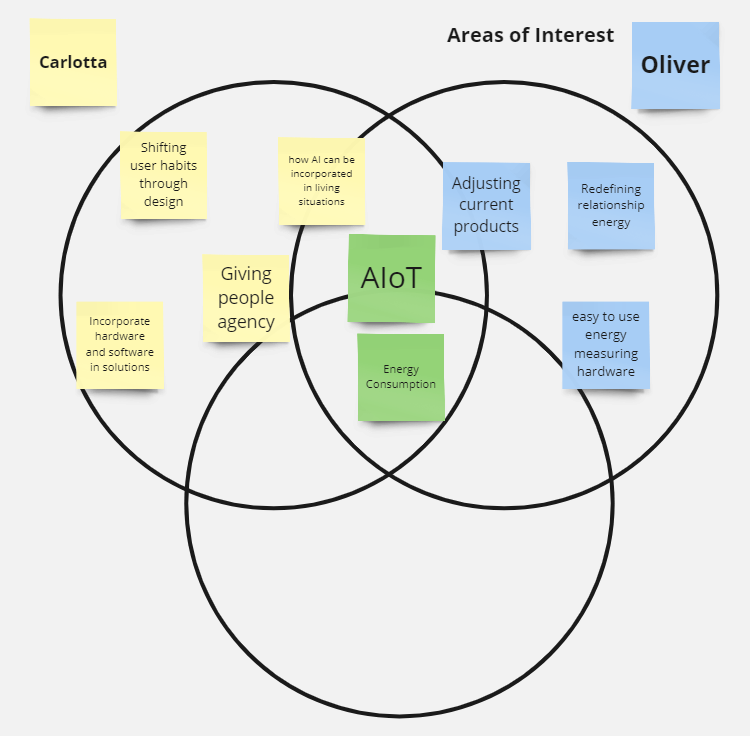
We knew we already shared a lot of the same interests when it came to this topic, so there was a steady amount of overlap. We both wanted to explore how we could combine energy consumption with AIoT (Artificial Intelligence of Things) to create easier and more intuitive forms of energy management.
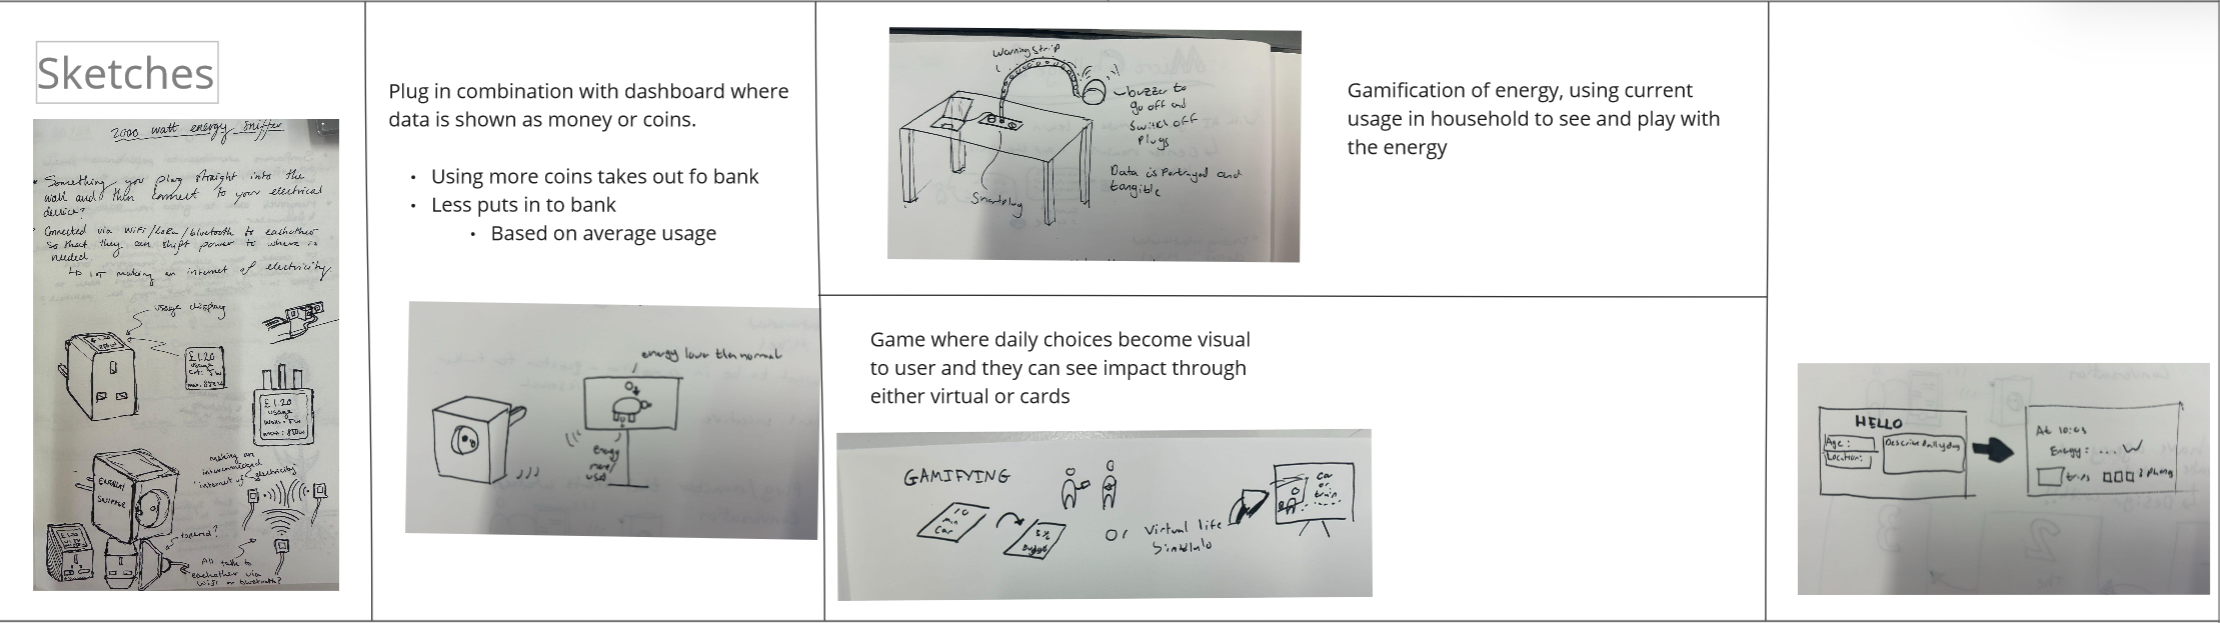
Then we sketched out a few ideas, thoughts on prototypes and made a plan for the rest of the week so that we could hit the ground running.
Learning by doing…
In our original plan for this week, we’d planned to make two things really, an open source way to display energy consumption from an energy monitor and (ideally) our own little open source energy monitor. We thought that we’d be able to get the software part done quickly as there were plenty of projects we could work off of to get the ball rolling (and we had that same exact thought for the monitor we wanted to build as well).
We were very wrong.
The software we developed took us much longer than we’d initially anticipated, and at this point we’d decided that we wanted to make sure that we could have the software working properly before we started working on anything else, we spent the entire week acting as rudimentary software developers.
For a pair of product designers previously trained almost exclusively on developing hardware this was certainly a challenge.
We most definitely learnt by doing throughout this entire week, and we put together a little video that encapsulates a lot of what we got up to during this development week which you can see below.
But it was all worth it.
Final Result ~ Open Energy Monitoring and a Conversational Consumption bot
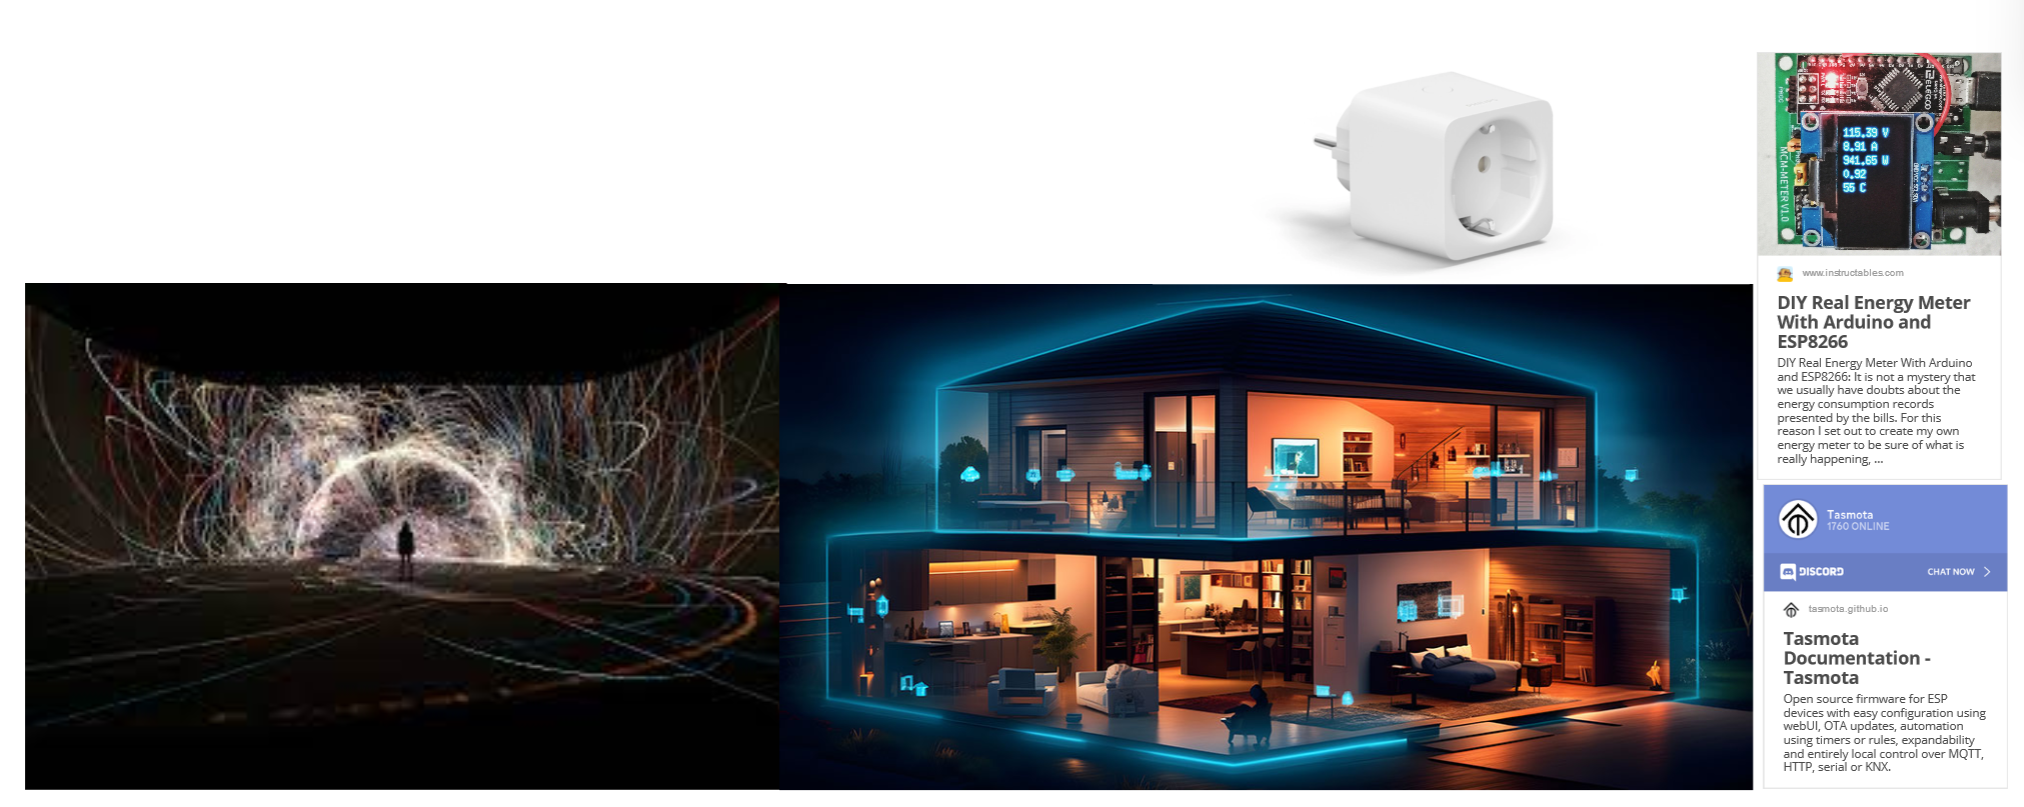
What we finally ended up developing over the course of the week was a little multi-faceted. We decided to use some of the Tapo smart plugs we’d bought and had been using for a previous intervention as our energy monitor of choice to speed up development time.
This turned out to be a great idea, as it turns out that someone else had wanted to do the same idea as us and read the data the plug was generating without needing the accompanying app. They had managed to develop a basic python script that would install and use a specific library unique to these Tapo Plugs, allowing you to read any information from them as well as control them as well.
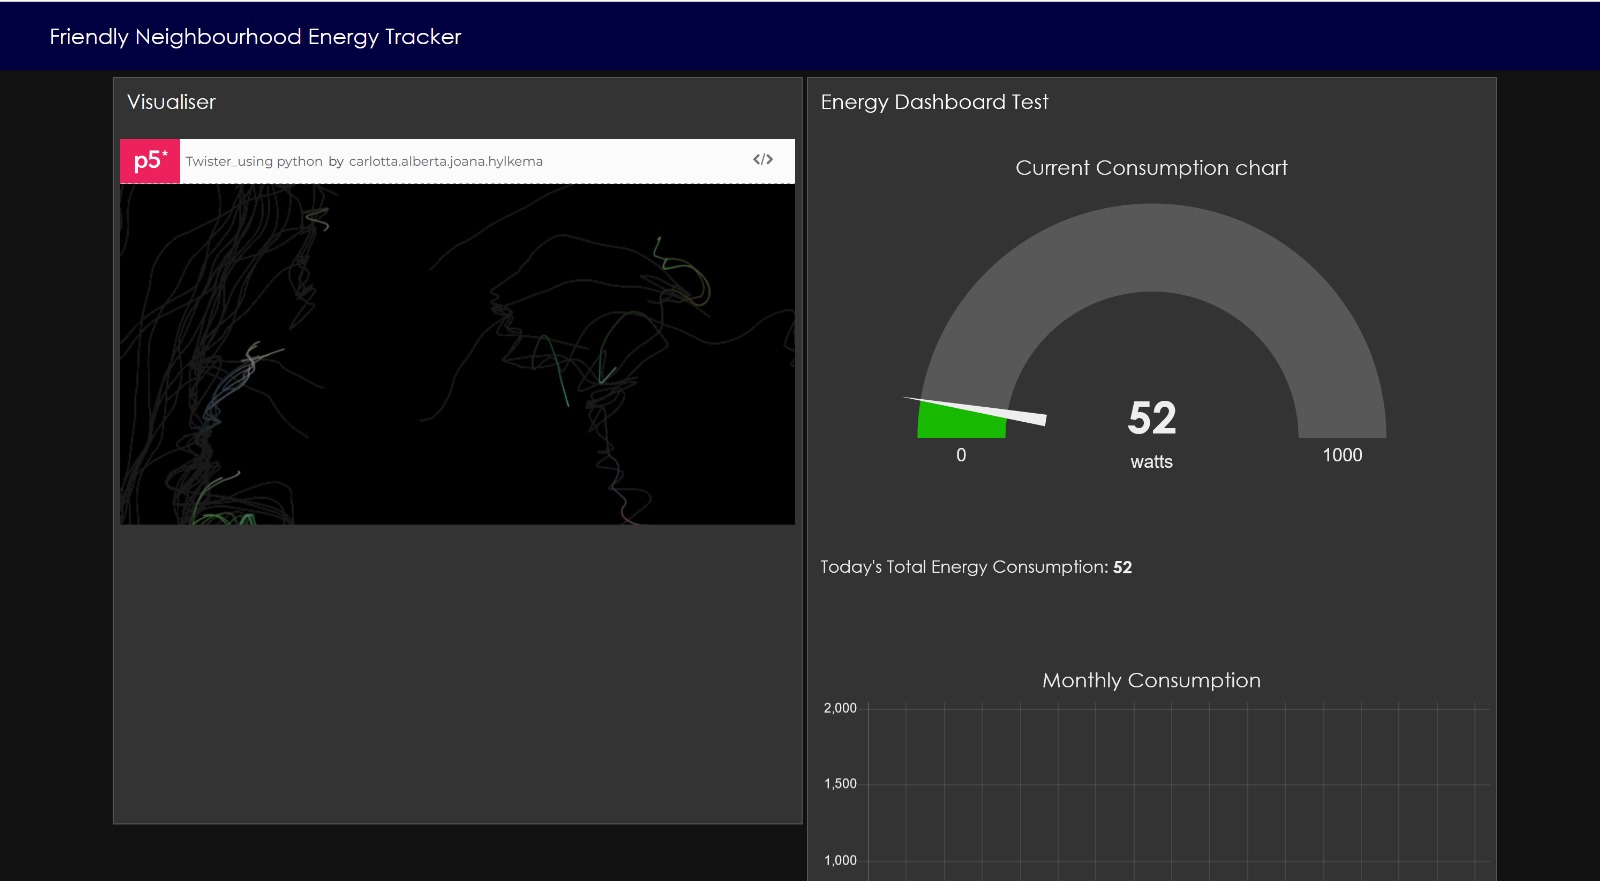
From this starting point we were able to develop the script even further to give us exactly what data we wanted from the plug i.e. Current Usage in Watts, Total Consumption, Monthly Consumption etc… we were then able to display this image through a a script Carlotta wrote in P5.js that would visualise that live consumption data in a way that was slightly more visually appealing. Finally we decided that it would be really interesting if you could “ask” your house for how much energy you were using through a text message.
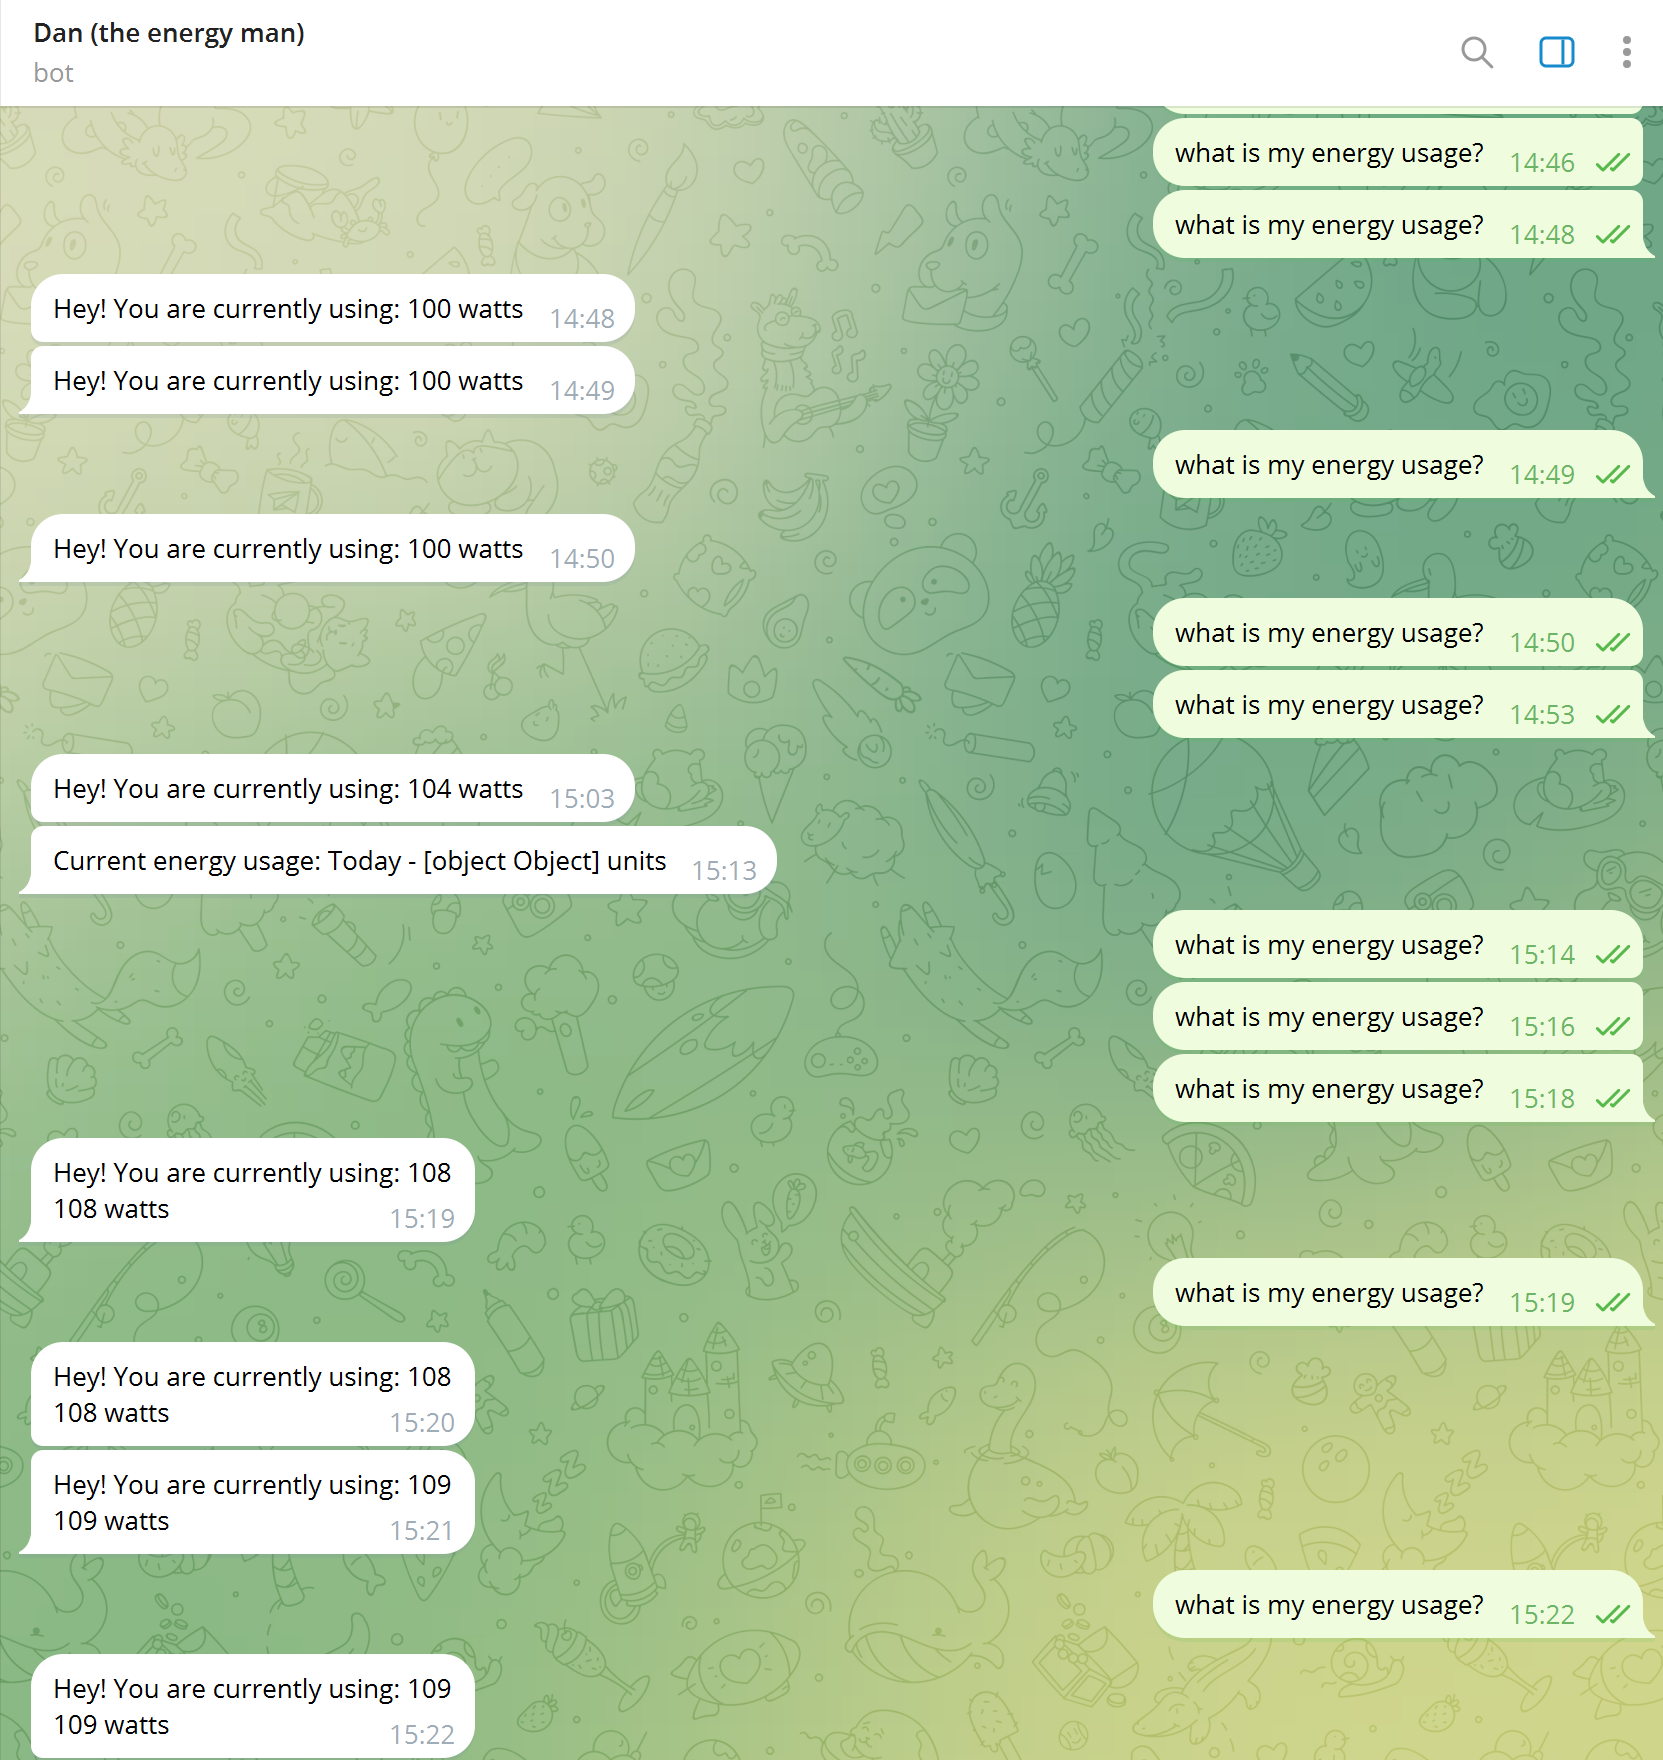
With this simple idea, Dan the Energy Bot was born.
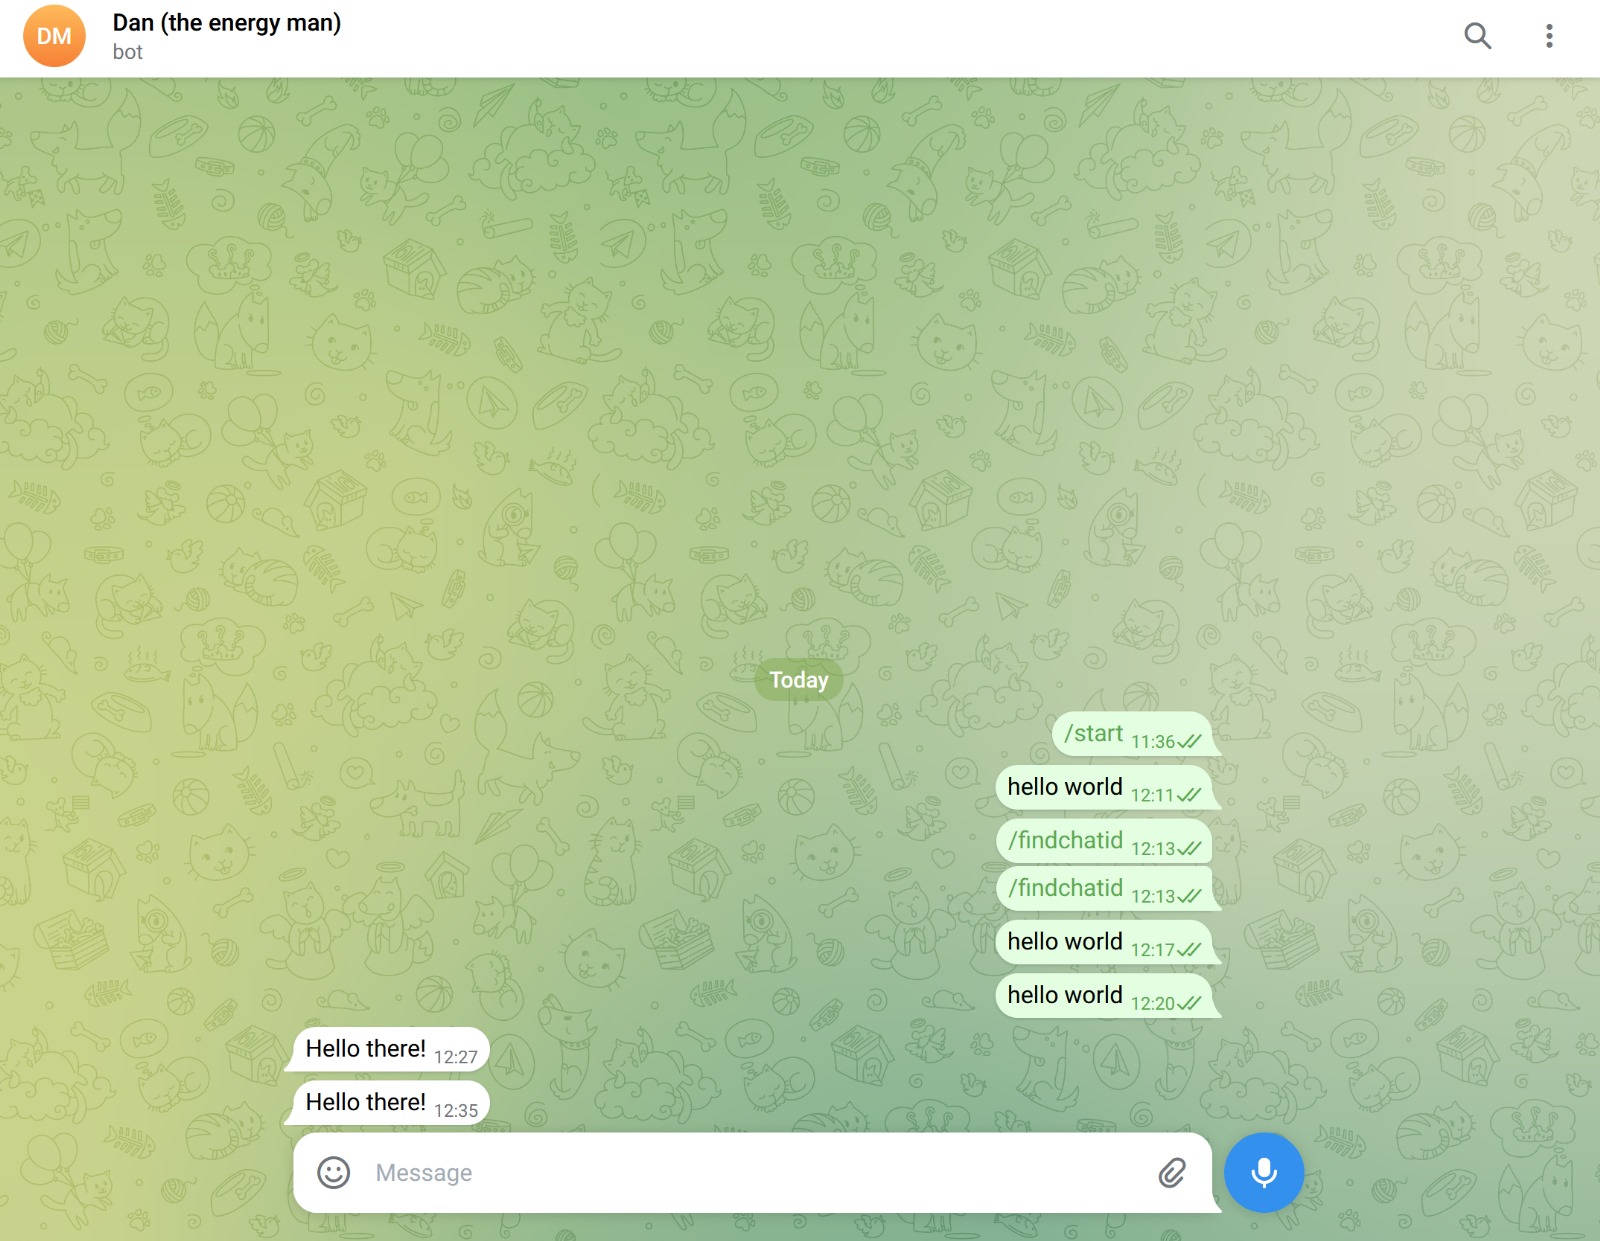
Dan the Energy Bot
We wanted to explore how we could create a more collaborative and conversational method of learning about your energy consumption and how to reduce it. We thought that if you were able to send a simple text message (in this case Telegram, but hopefully more messenger services later) asking what your energy consumption was and it would respond with telling you your current usage.
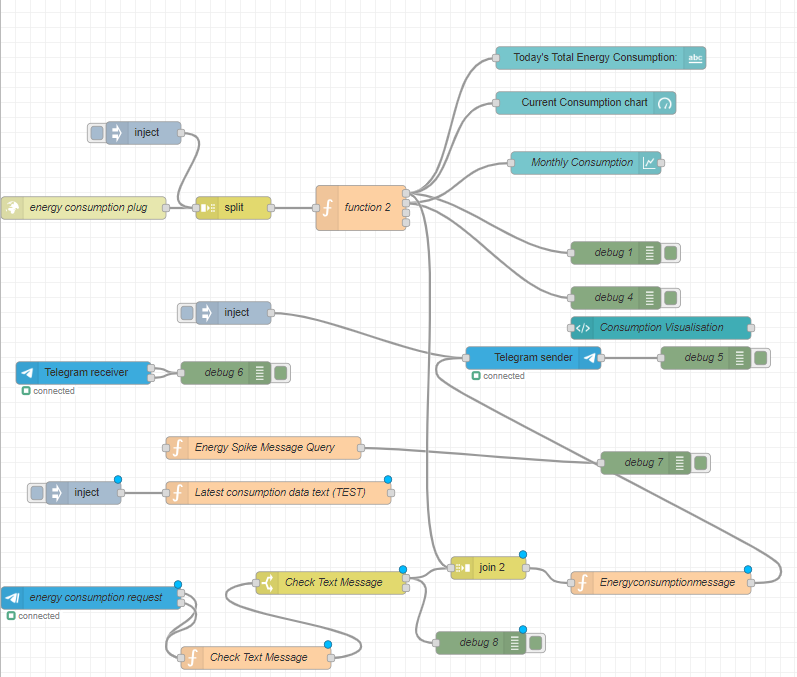
We built the entire system in an environment called Node-Red, which is an open source program dedicated to connecting different APIs and other information sources together. It allows you to build out any kind of automation system you want and is a favourite for open source electronics projects or home automation systems and for good reason. After a bit of a learning curve we were able to get the hang of it and built out or system for right now.
While it works, there are still a few flaws, Dan is very keen to provide you with your usage once you’ve asked and we aren’t quite sure how to turn him off once he’s started but that’s a problem for the next challenge: Working with Extended Intelligence
Final Thoughts and Next Steps
This was a really intense week, but it was also incredibly rewarding. We learned far more about coding than we thought we would, and we developed something that we really hadn’t thought we would either. We learned the limits of what we could produce in such a short time as well as the limits of the existing technologies we were using. Once we’d crossed the hurdle of figuring out how to “hack” the tech we had to do what we wanted to do it set us off an an exciting path as new ideas formed for what we could develop further to improve on these technologies.
We definitely want to keep developing our consumption AI to develop it into a much more useful learning companion, as well as keep going with developing an energy monitor that could be developed from a kit you could put together at home.
We now also want to explore if it´s possible to combine all these technologies together to create one system that can monitor your whole home’s energy consumption without needing multiple “smart” plugs connected all over the home, and return useful information that allows you to make hyper personalised adjustments based on your needs.
Like a self learning smart meter, just really chatty and inquisitive. Learning from you and with you as you figure out just how much energy your home is consuming