Measuring the World
Measuring the World, One byte at a time
Too Long Didn’t Read
In the “Measuring the World” module, we explored data gathering and its transformation into usable information. Focusing on energy consumption, we tackled the ethical questions of data ownership and usage. Our group project aimed to navigate cities healthily by considering sunlight and starlight exposure. Using a Raspberry Pi camera and light level analysis, we created routes in Barcelona that maximize sun exposure and minimize light pollution. This exercise highlighted the importance of open data and the ethical considerations of using it for product development.
Where does our information come from?
We recently wrapped up our module “Measuring the World”, led by Oscar Gonzalez. In it, we learned how we use sensors and other measuring tools to gather data about the world, and the processes that have to be taken to turn that raw data into useful information.
We examined how raw data is turned into usable information, the differences between open data and closed data, and now that new data-gathering technologies like satellites are becoming publicly available, we discussed the questions now being asked such as:
- How do we go about using all this new data in a way that turns it into something useful?
- Where does data brokerage come in?
- Is it now suddenly an open market for data?
- It’s open data, meaning it’s freely available to everyone, but where is this information coming from?
I thought this was a really interesting area to explore, as right now my focus for my thesis project is all about energy, our relationships to our consumption of it, and how we can use technology to get a clearer picture that helps us make decisions about our consumption of this resource.
So for me, this module fit really well with this research interest, as one of the ways to begin to answer this thesis question is to understand that we need ever-increasing amounts of data. We need ways to turn that data into useful information that can help us develop products, services or policies that make other people’s lives easier.
But it’s easy to focus on this aspect without stopping to ask “Where does all this data come from? Who owns it? Who gets to use it?”
It’s something that I think is really interesting to explore within this topic. We live in the information age, on the cusp of the age of AI, where information is as valuable as raw material from the Earth. Without stopping to address the questions about data sovereignty and ownership in developing solutions around energy consumption, we might end up not with a new and better system, but a rehashing of the same dominant system we are trying to emerge from.
Group Project ~ Navigating Cities in a Healthier Way
The Idea
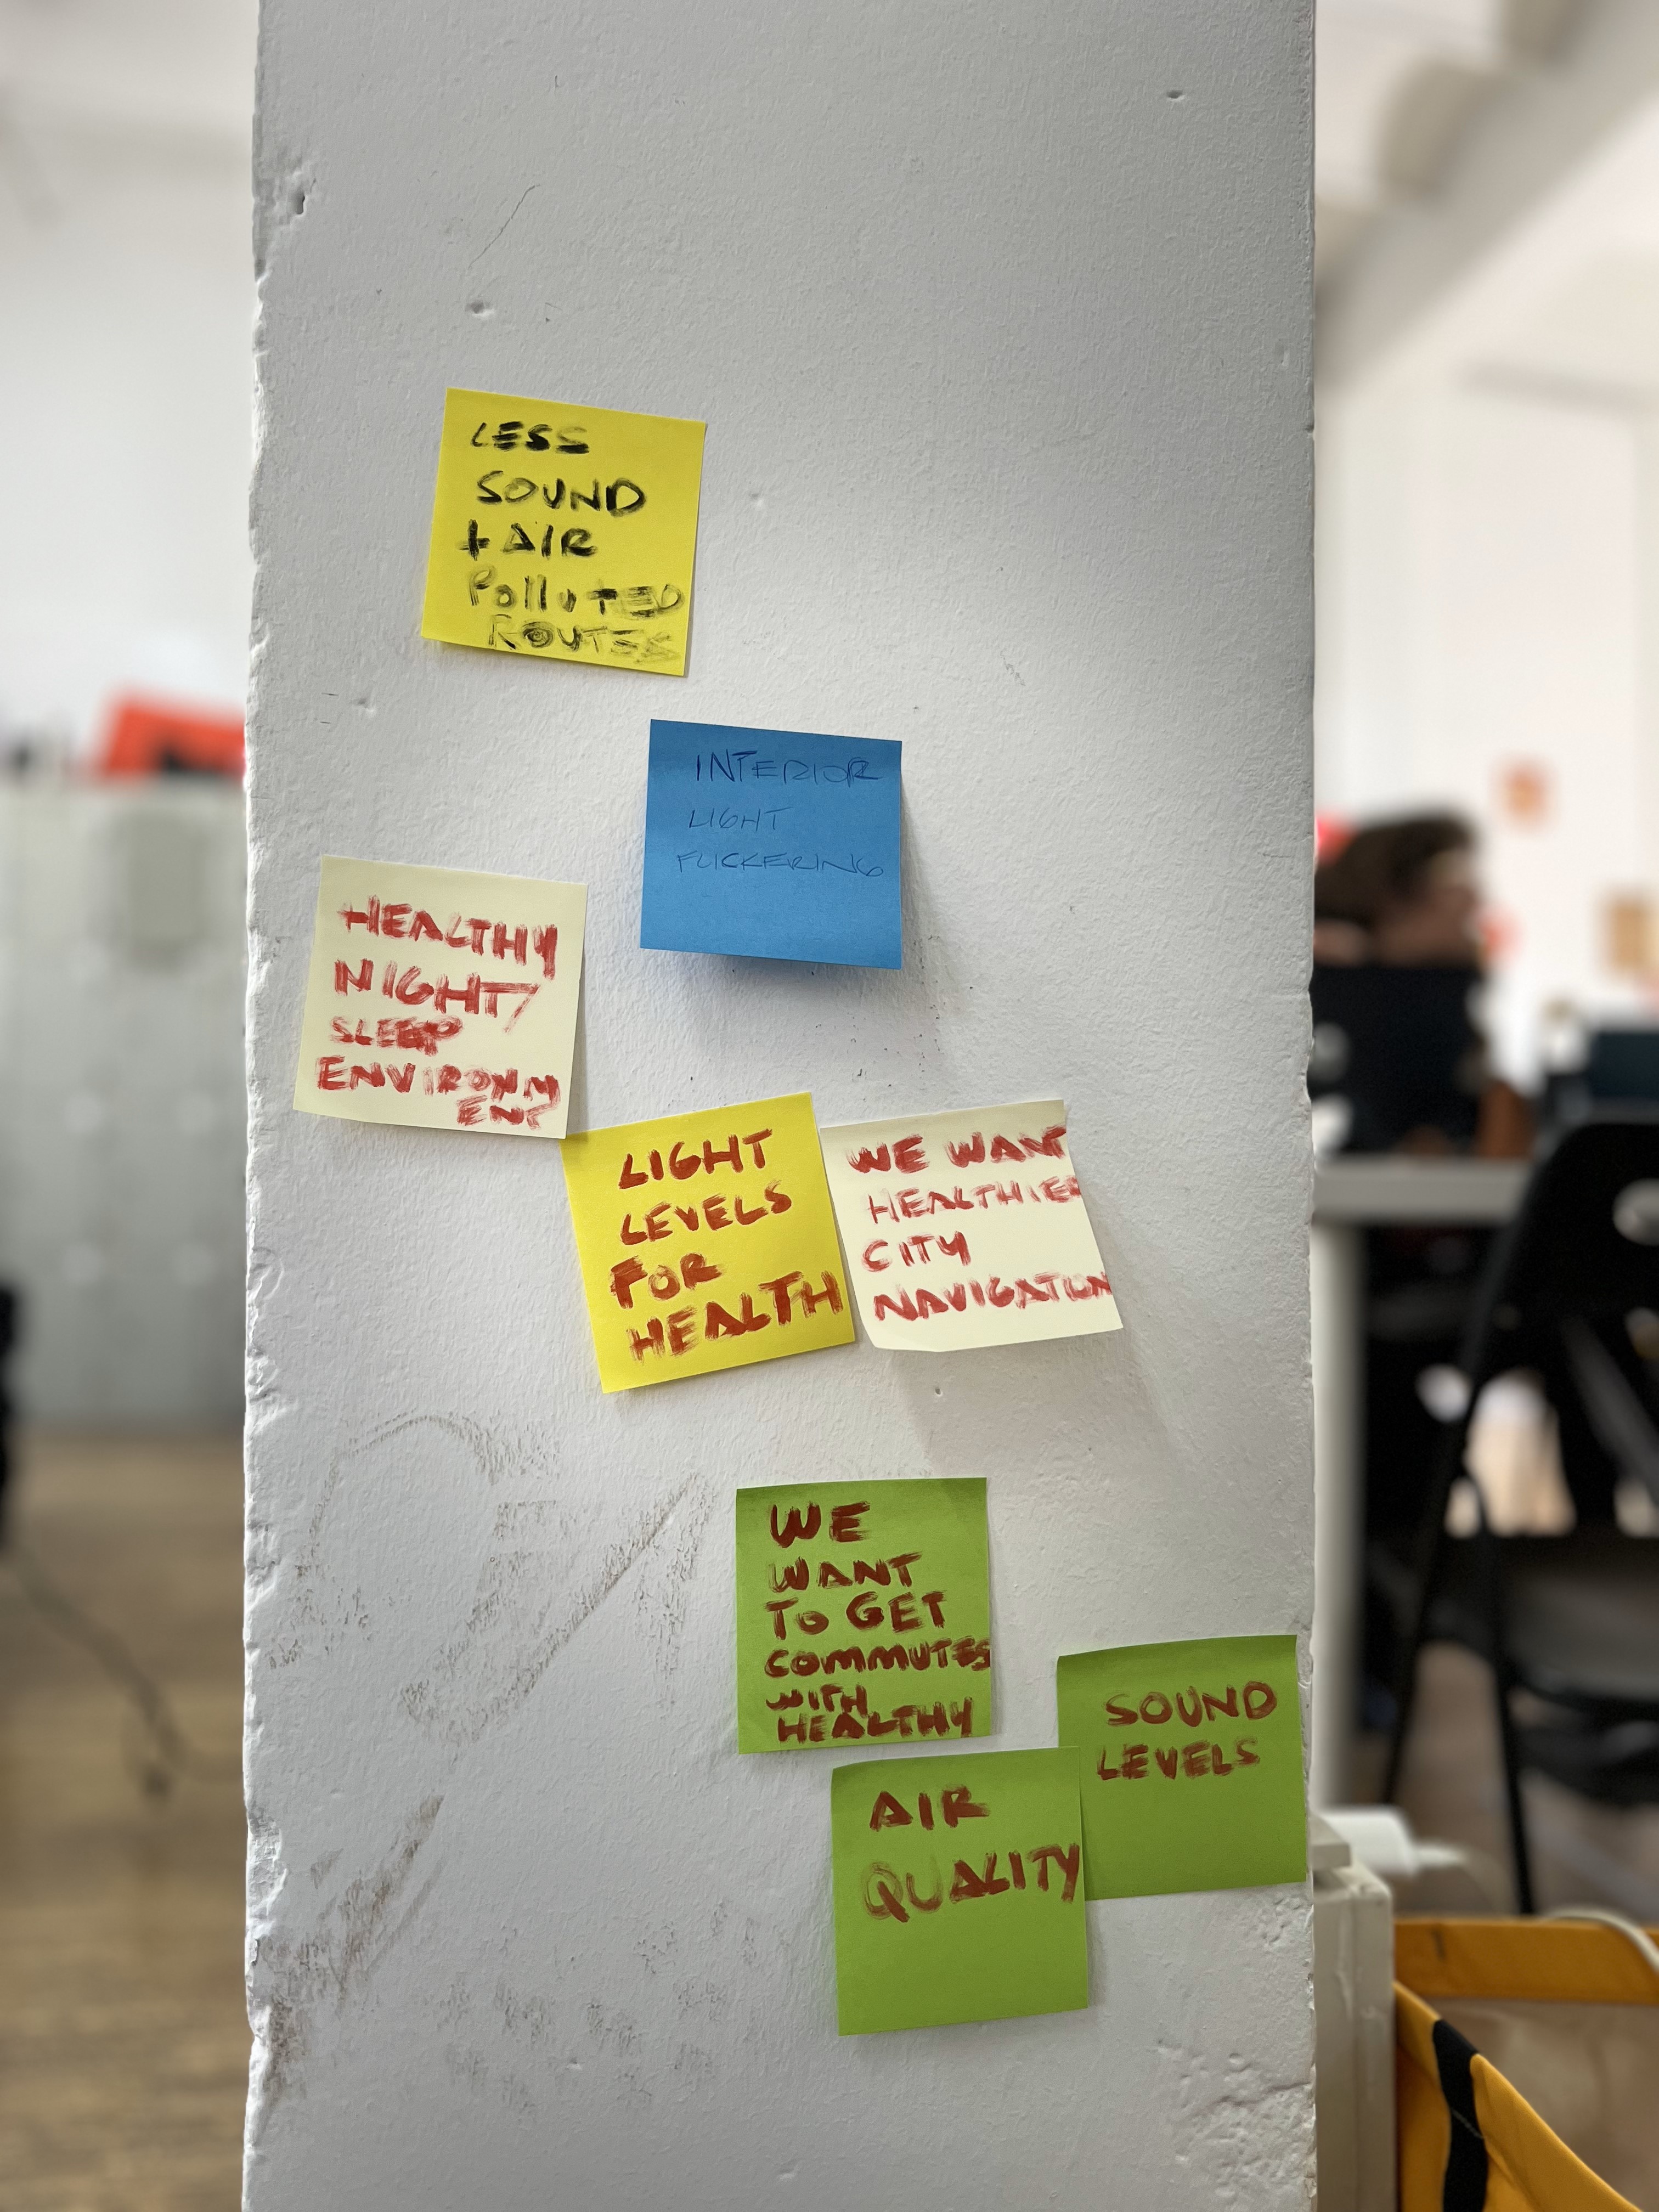
Throughout the week, we tried to apply all this knowledge into a 3-day long group project, where we focused on applying data to solutions that could be implemented in the real world.
In our group, we decided to focus on the question:
“How can we navigate cities in a healthier way?”
We didn’t want to address healthy navigation in terms of speed and efficiency, but we wanted to see if it was possible to navigate a city that took into account:
- Air Pollution
- Noise Pollution
- Light Pollution
- Sun Exposure
- Shade Exposure
The Broad Brief
The Brief we gave ourselves was:
“How might we use publicly available sensors and data from repositories to create a healthier city navigation experience?”
After a series of discussions amongst ourselves, we realised that we needed to focus on just one of these aspects for this first trial (naturally we wanted to do all of them, and quickly realised that we may have bit off a bit more than we could chew for a 3-day timeline) so we decided to focus on something a bit more unconventional, Sunlight and Starlight Exposure.
Narrow Focus
- Is it possible to navigate through the city of Barcelona on a morning commute and expose yourself to the sun at all times or immerse yourself in shade entirely?
- At night, is it possible to walk a in a street with the least amount of light pollution, so you can try and see some of the stars in the night sky?
It was a really interesting experiment, and we were limited by some technology constraints set by Oscar to add some creative spice to the challenge.
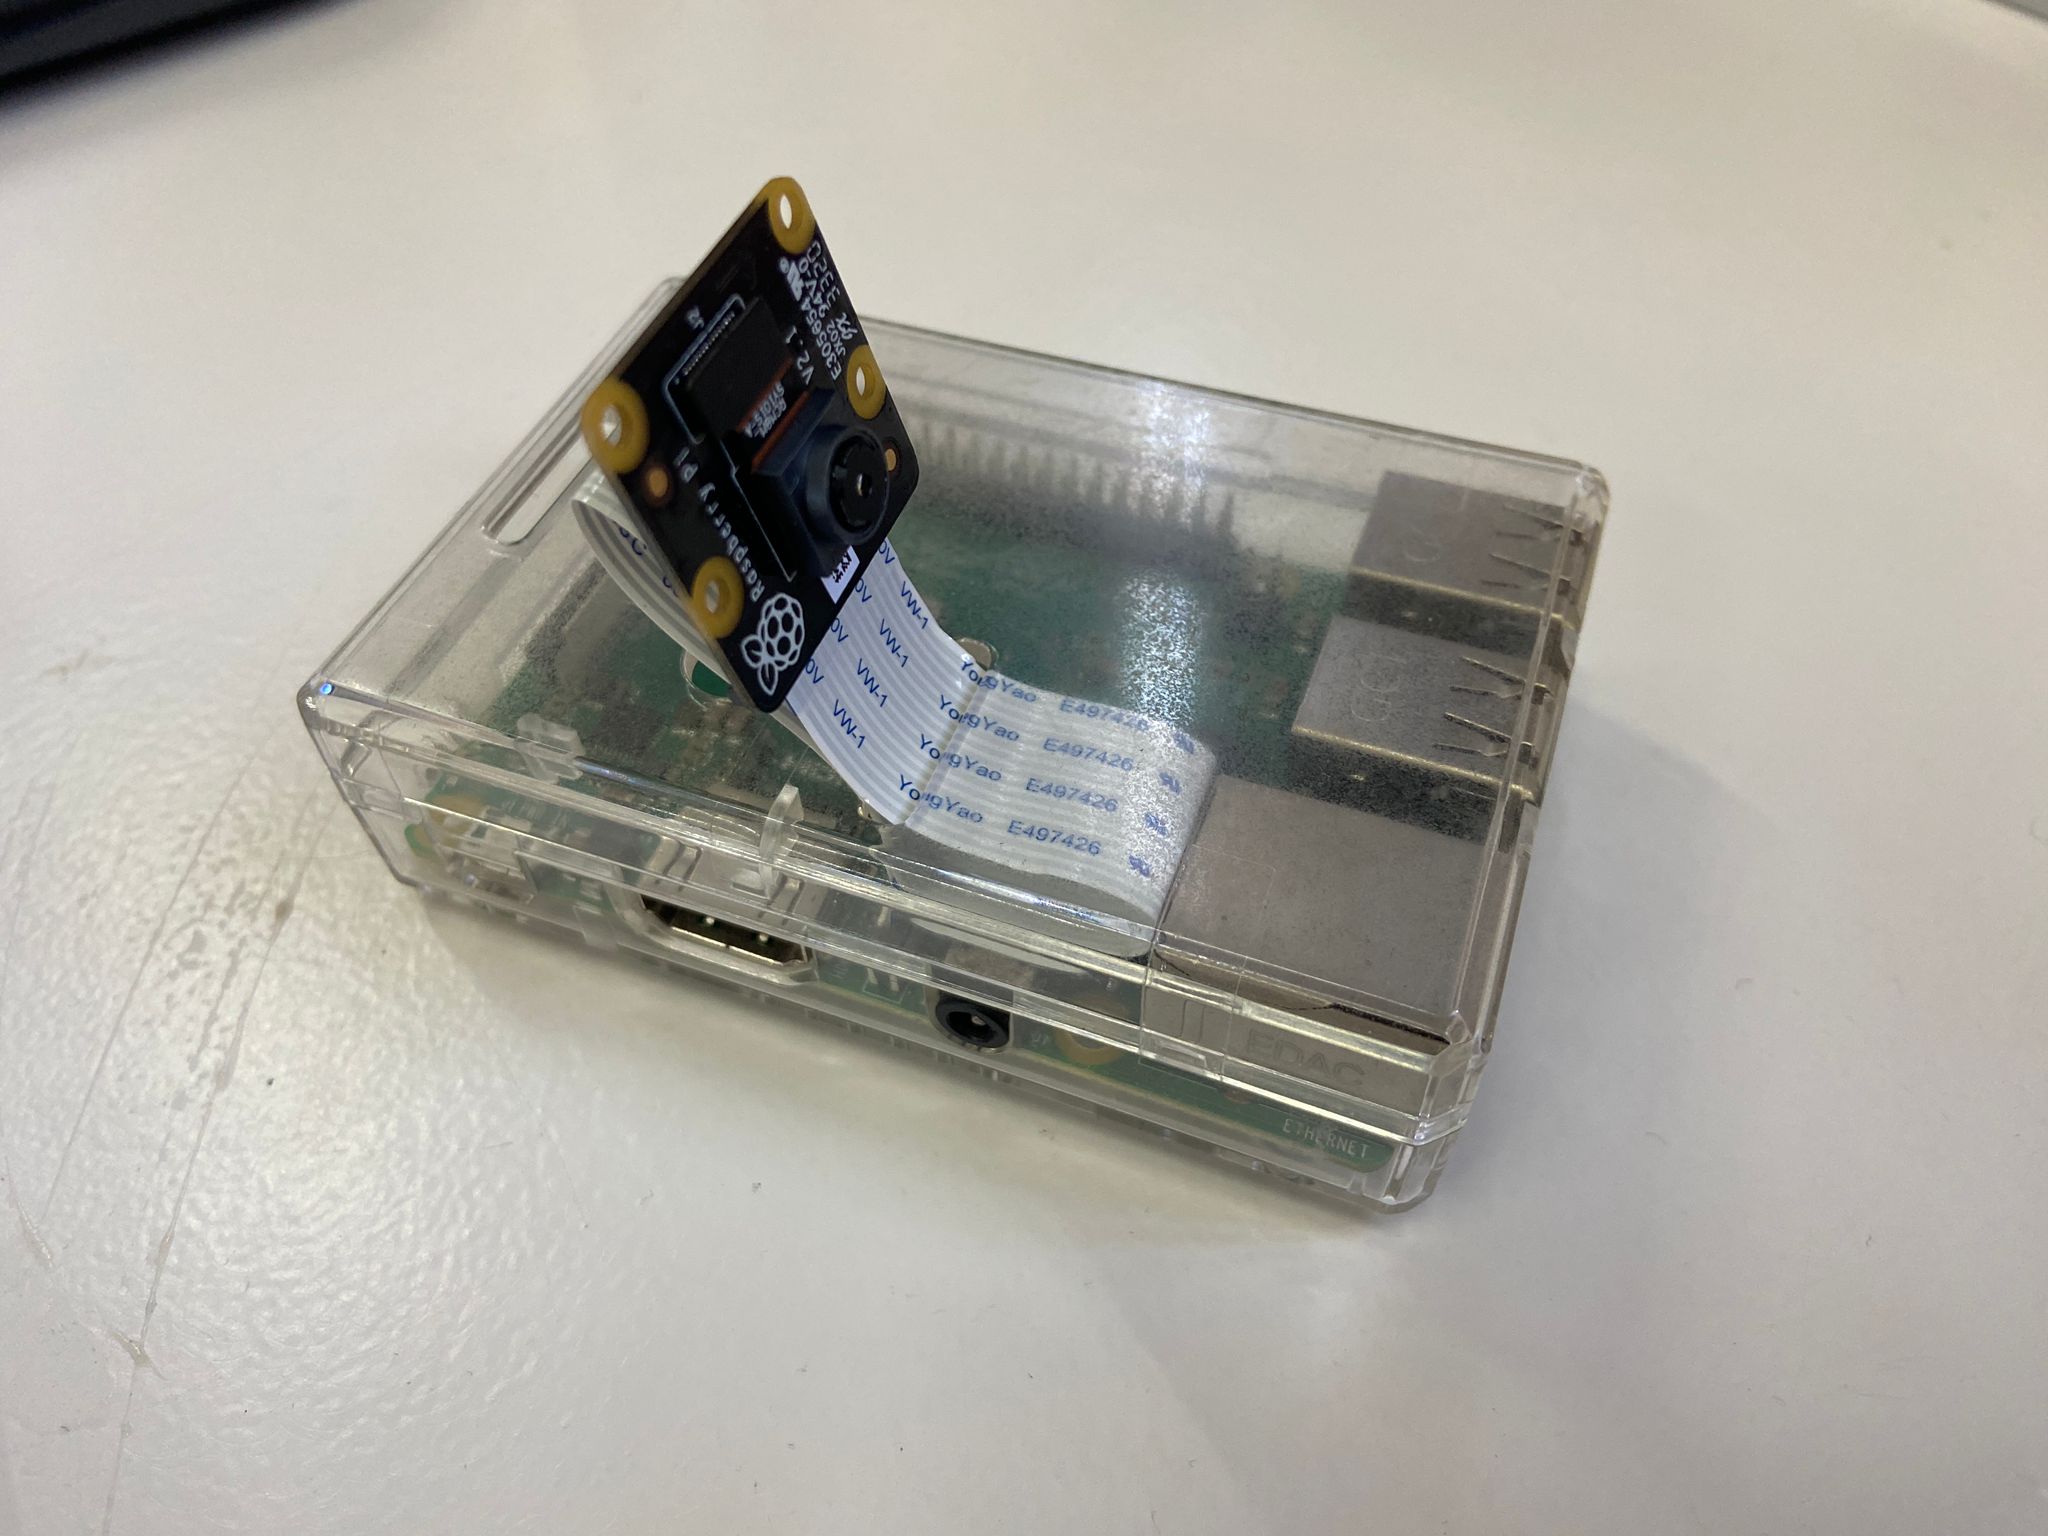
We had to bid amongst other groups for 1 of 4 methods of data gathering:
- A raspberry pi camera
- A smart citizen kit
- A Barduino
- A physical Intervention
What we did
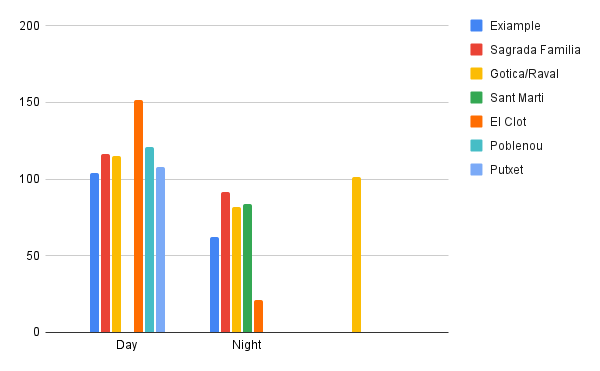
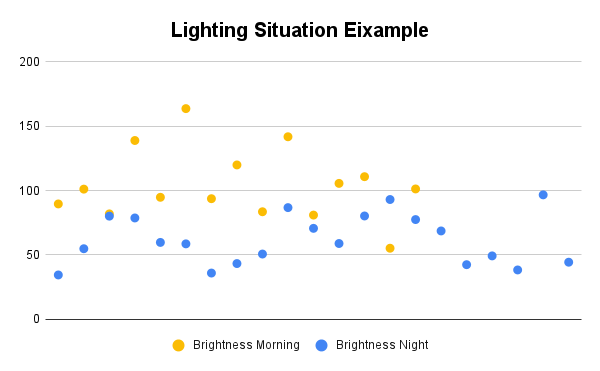
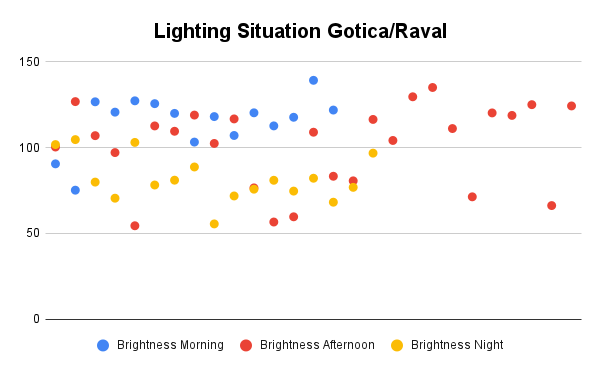
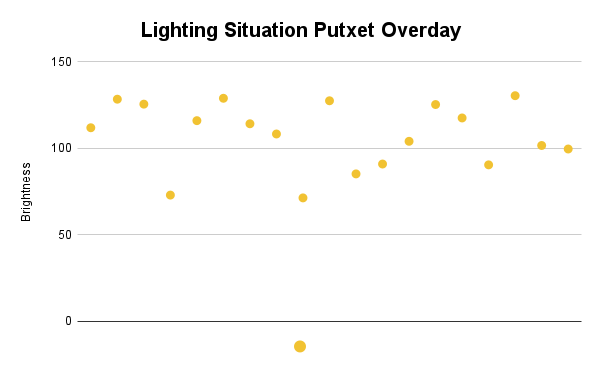
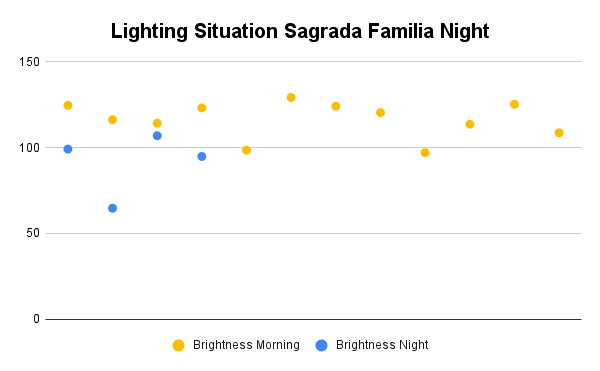
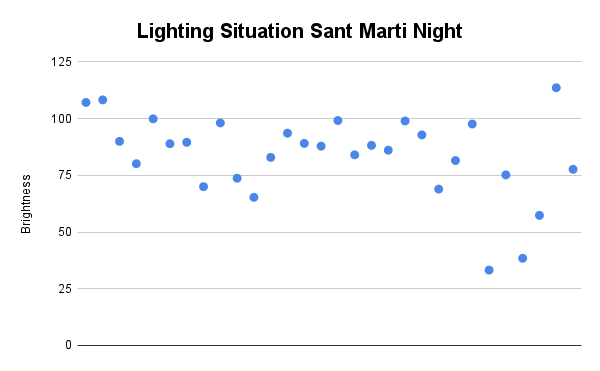
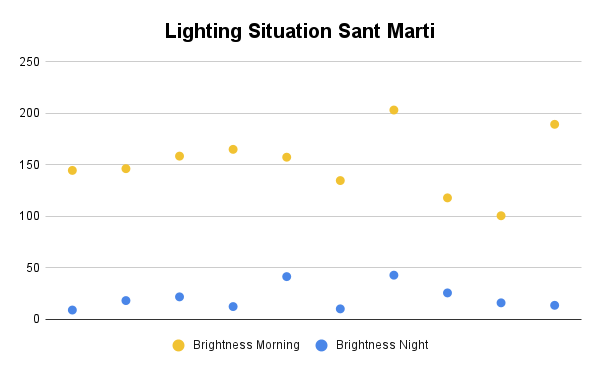
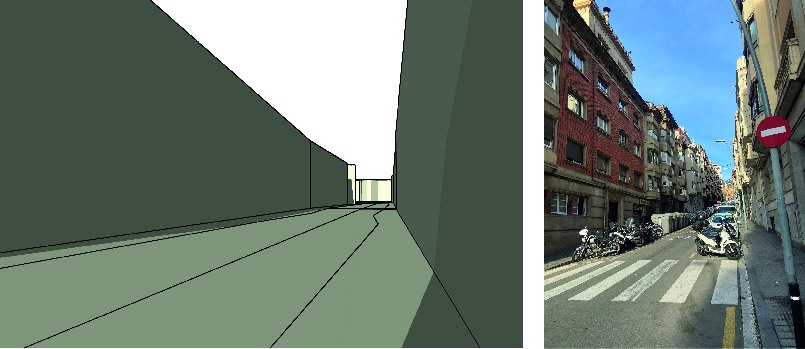
We bid on (and finally won, after a lot of back and forth) the Raspberry Pi camera which we used to take pictures of the streets in different neighbourhoods of the city, walking the same routes during the day and the night. We would then take those pictures and analyse them looking for bright spots and dark spots by using a bit of Python code written by 1 of our team members, Carlotta, to turn all the images we’d taken into grayscale and analyse the light levels.
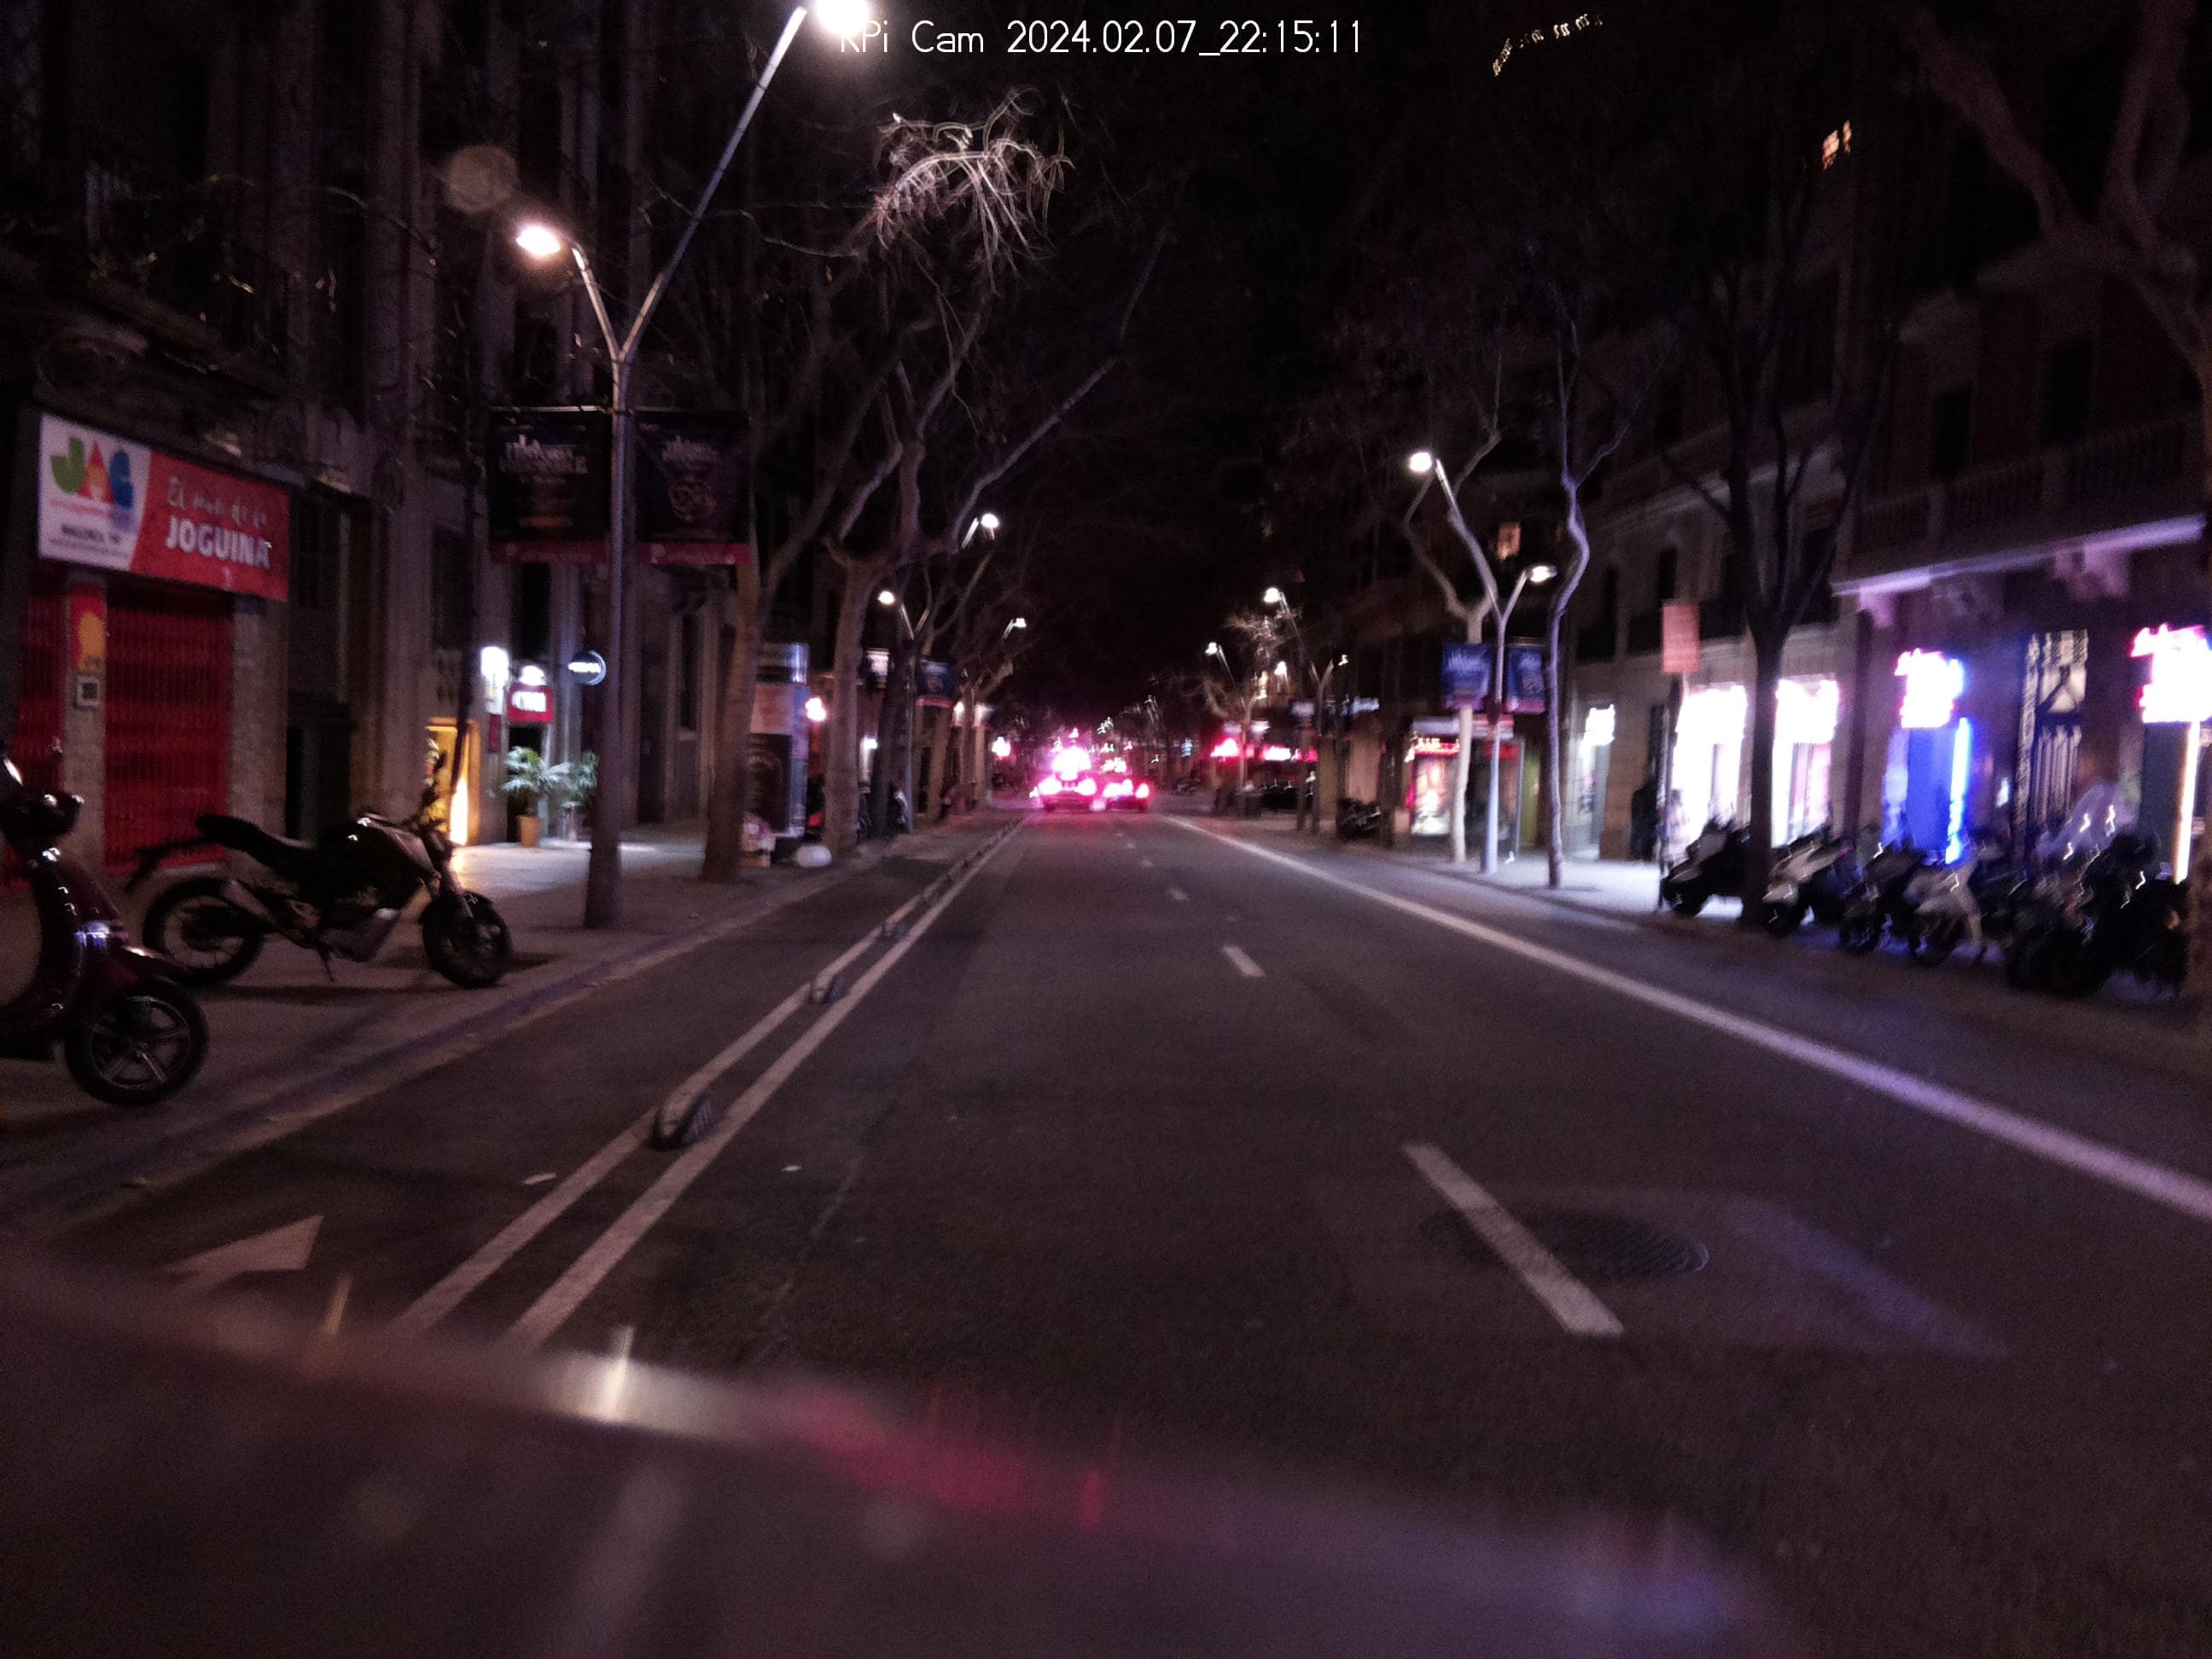
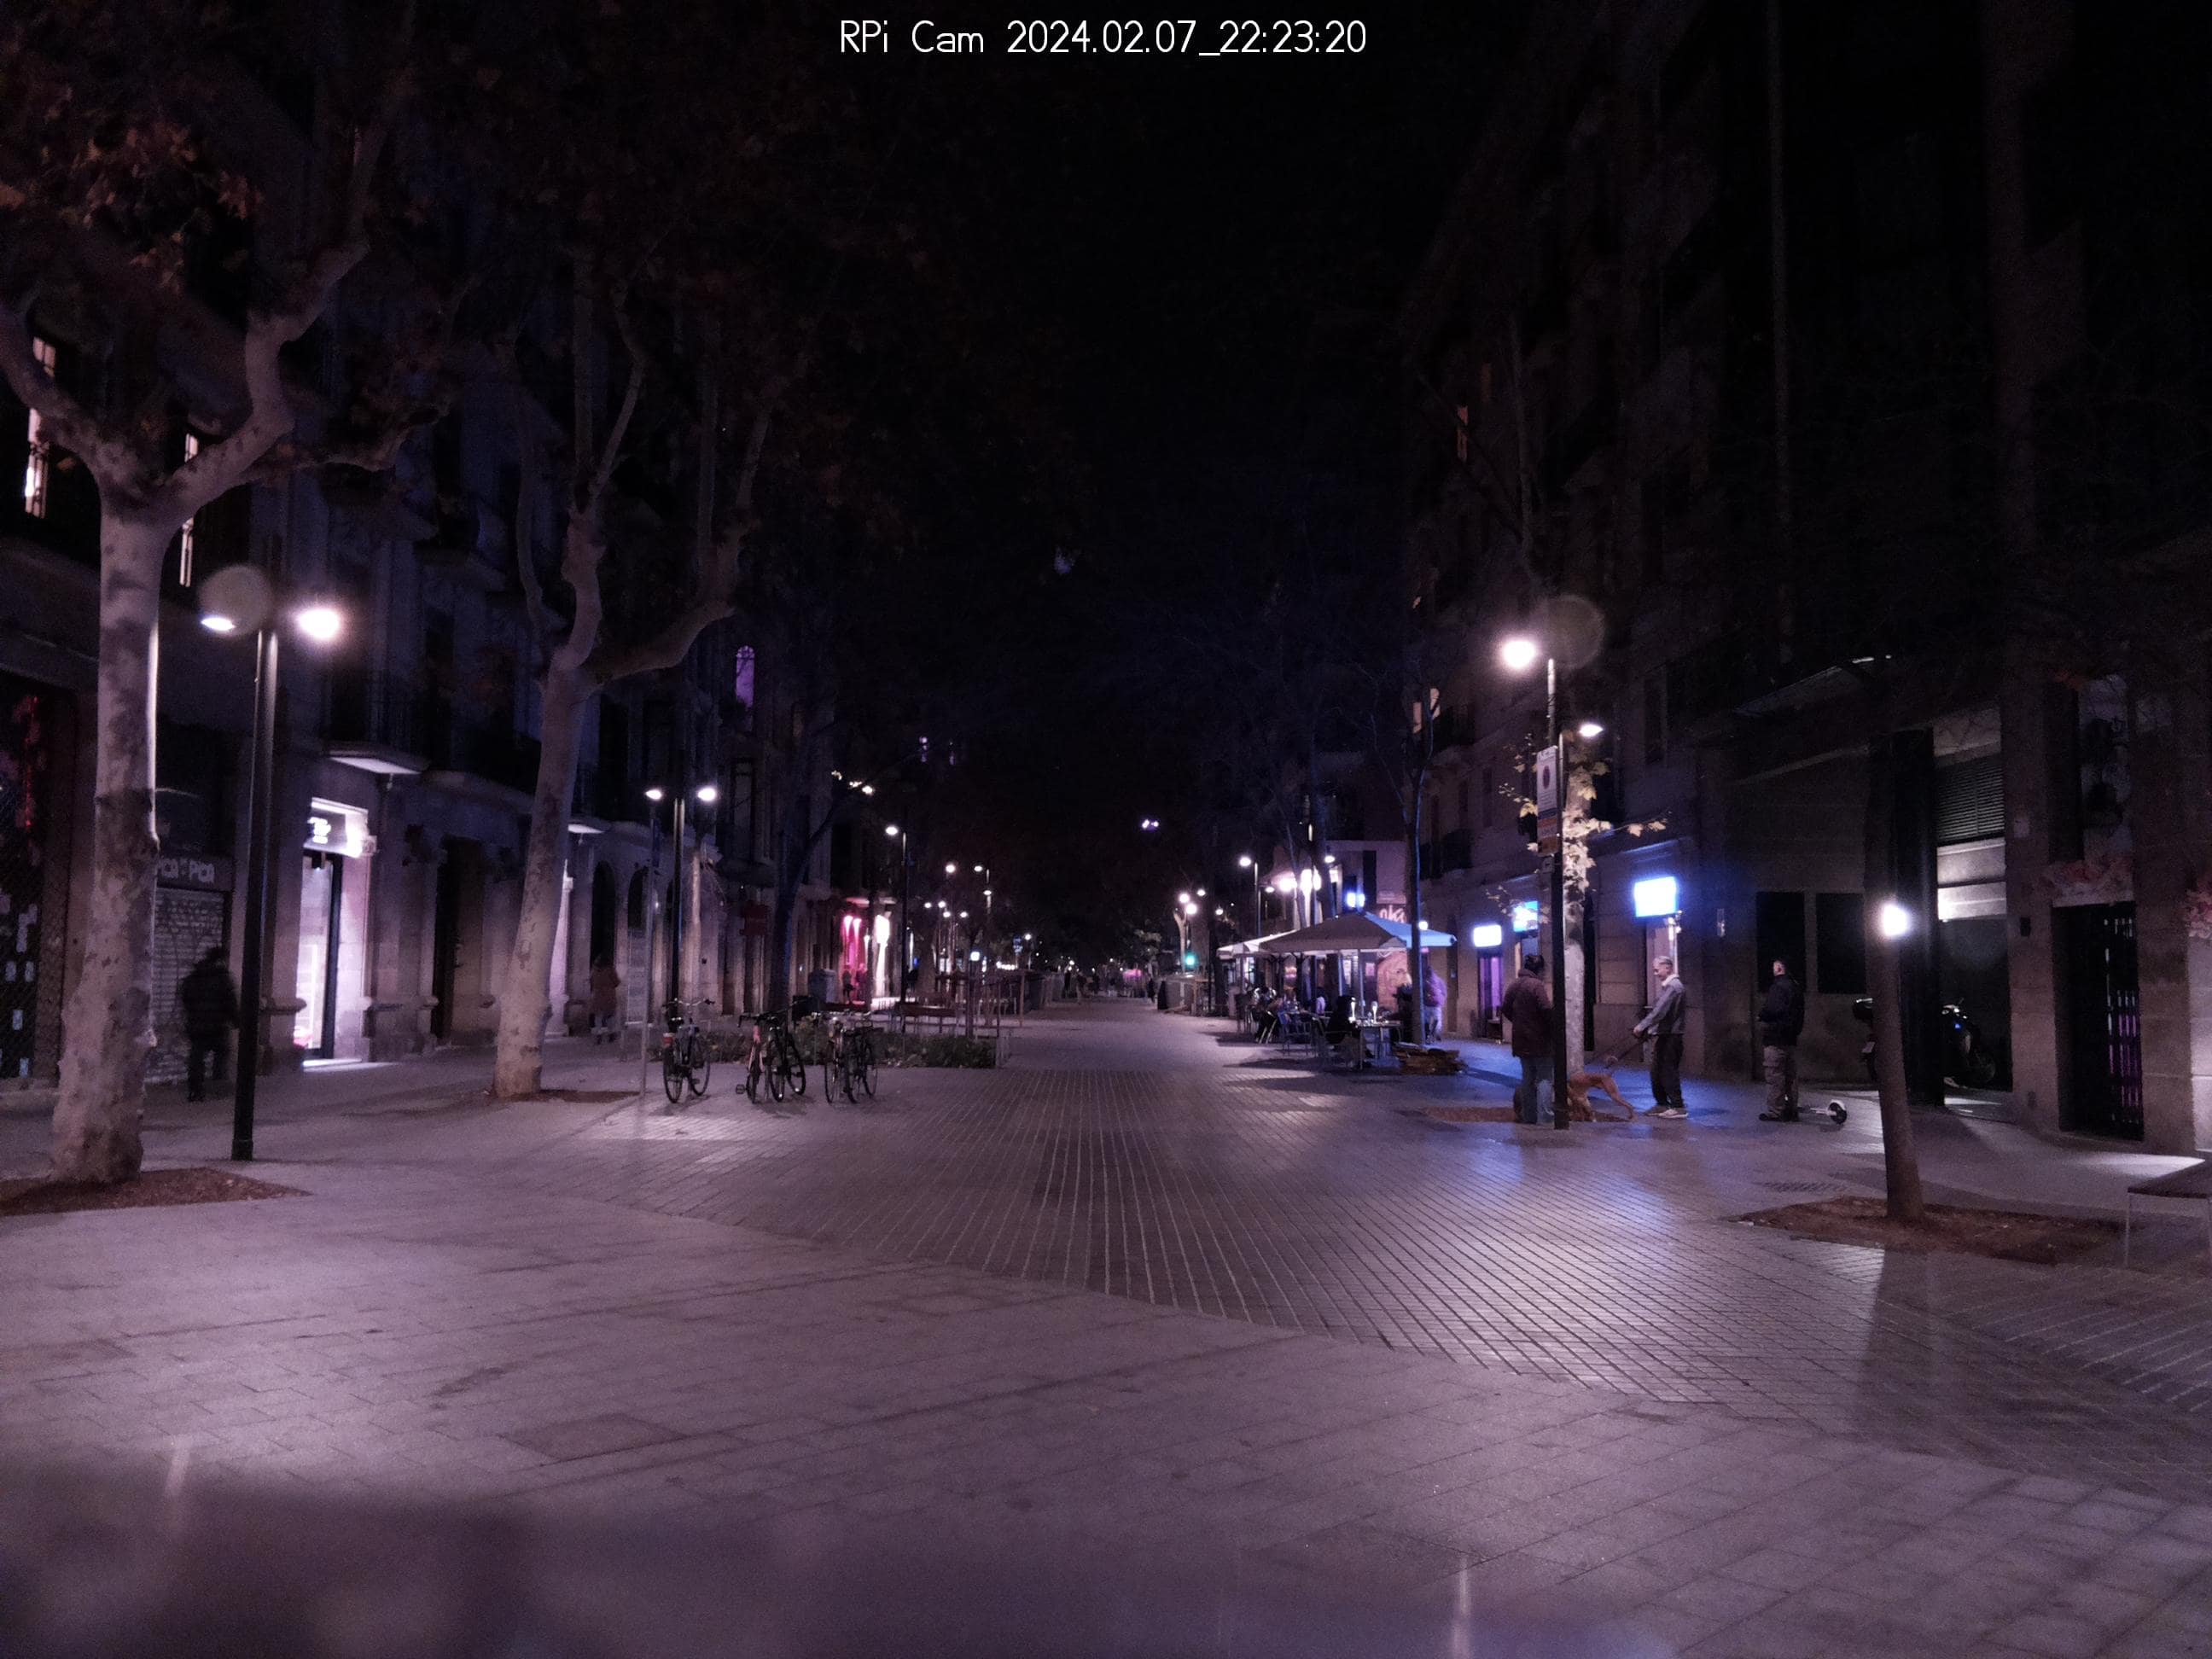
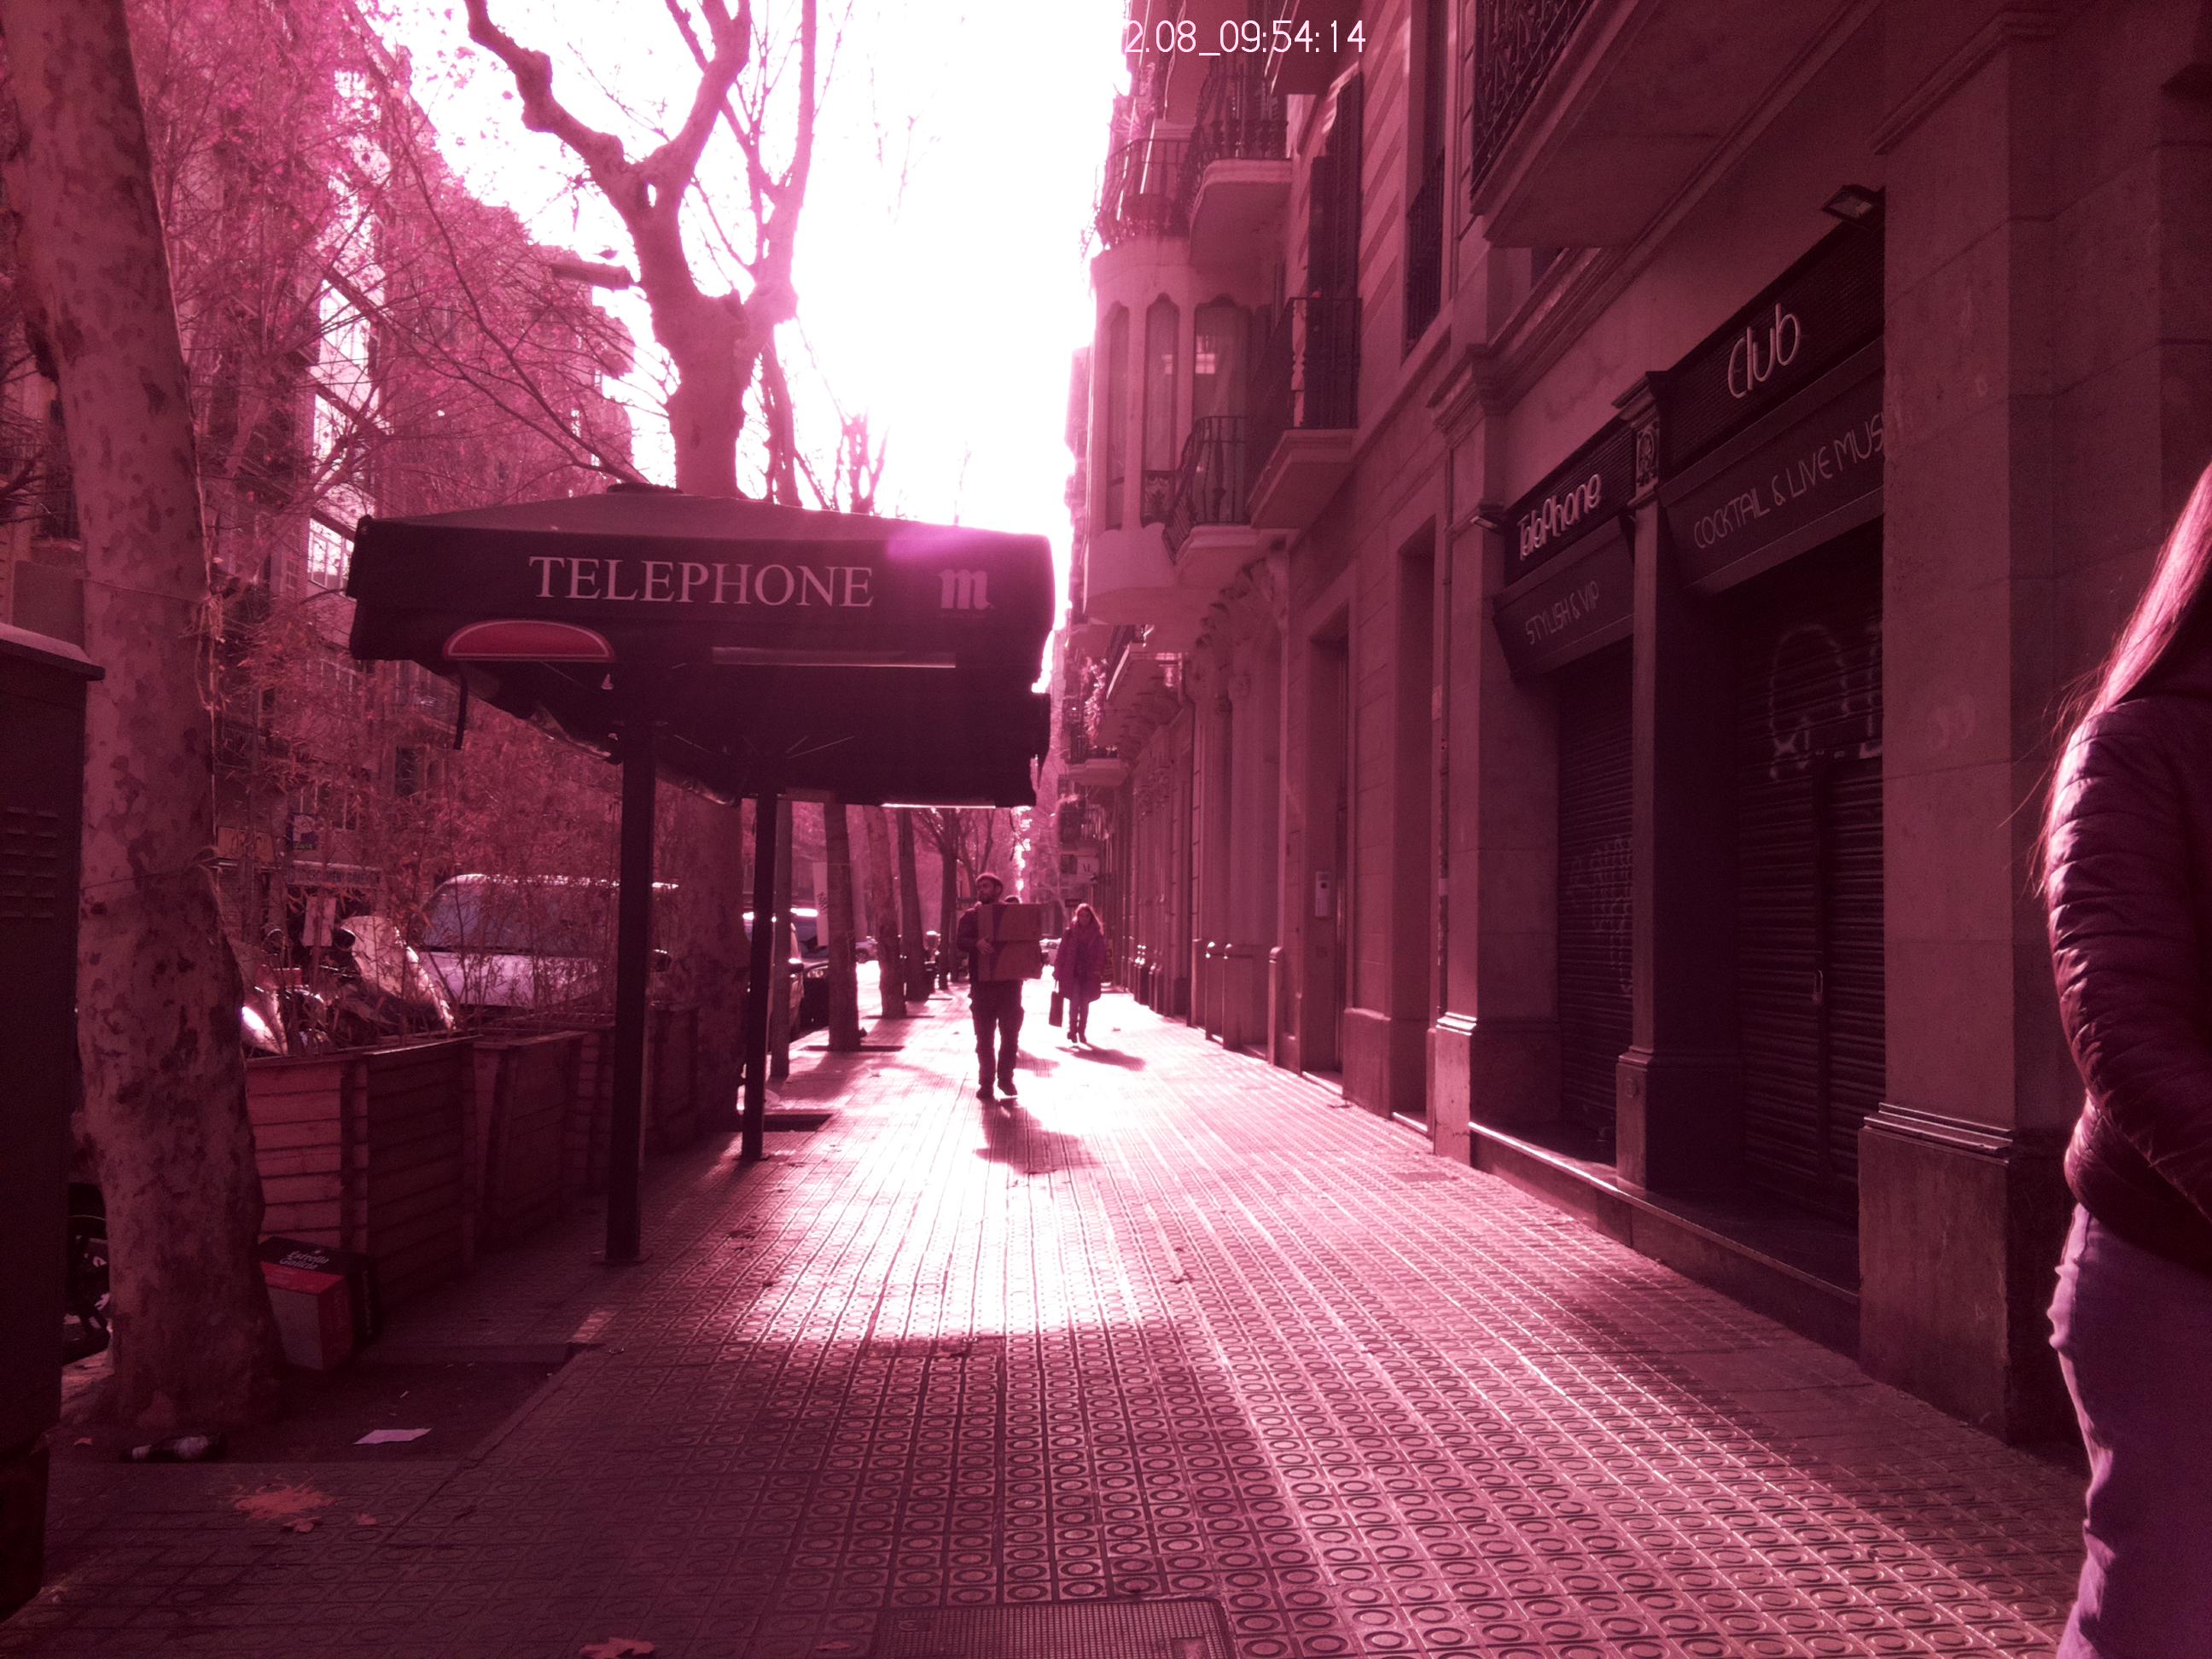
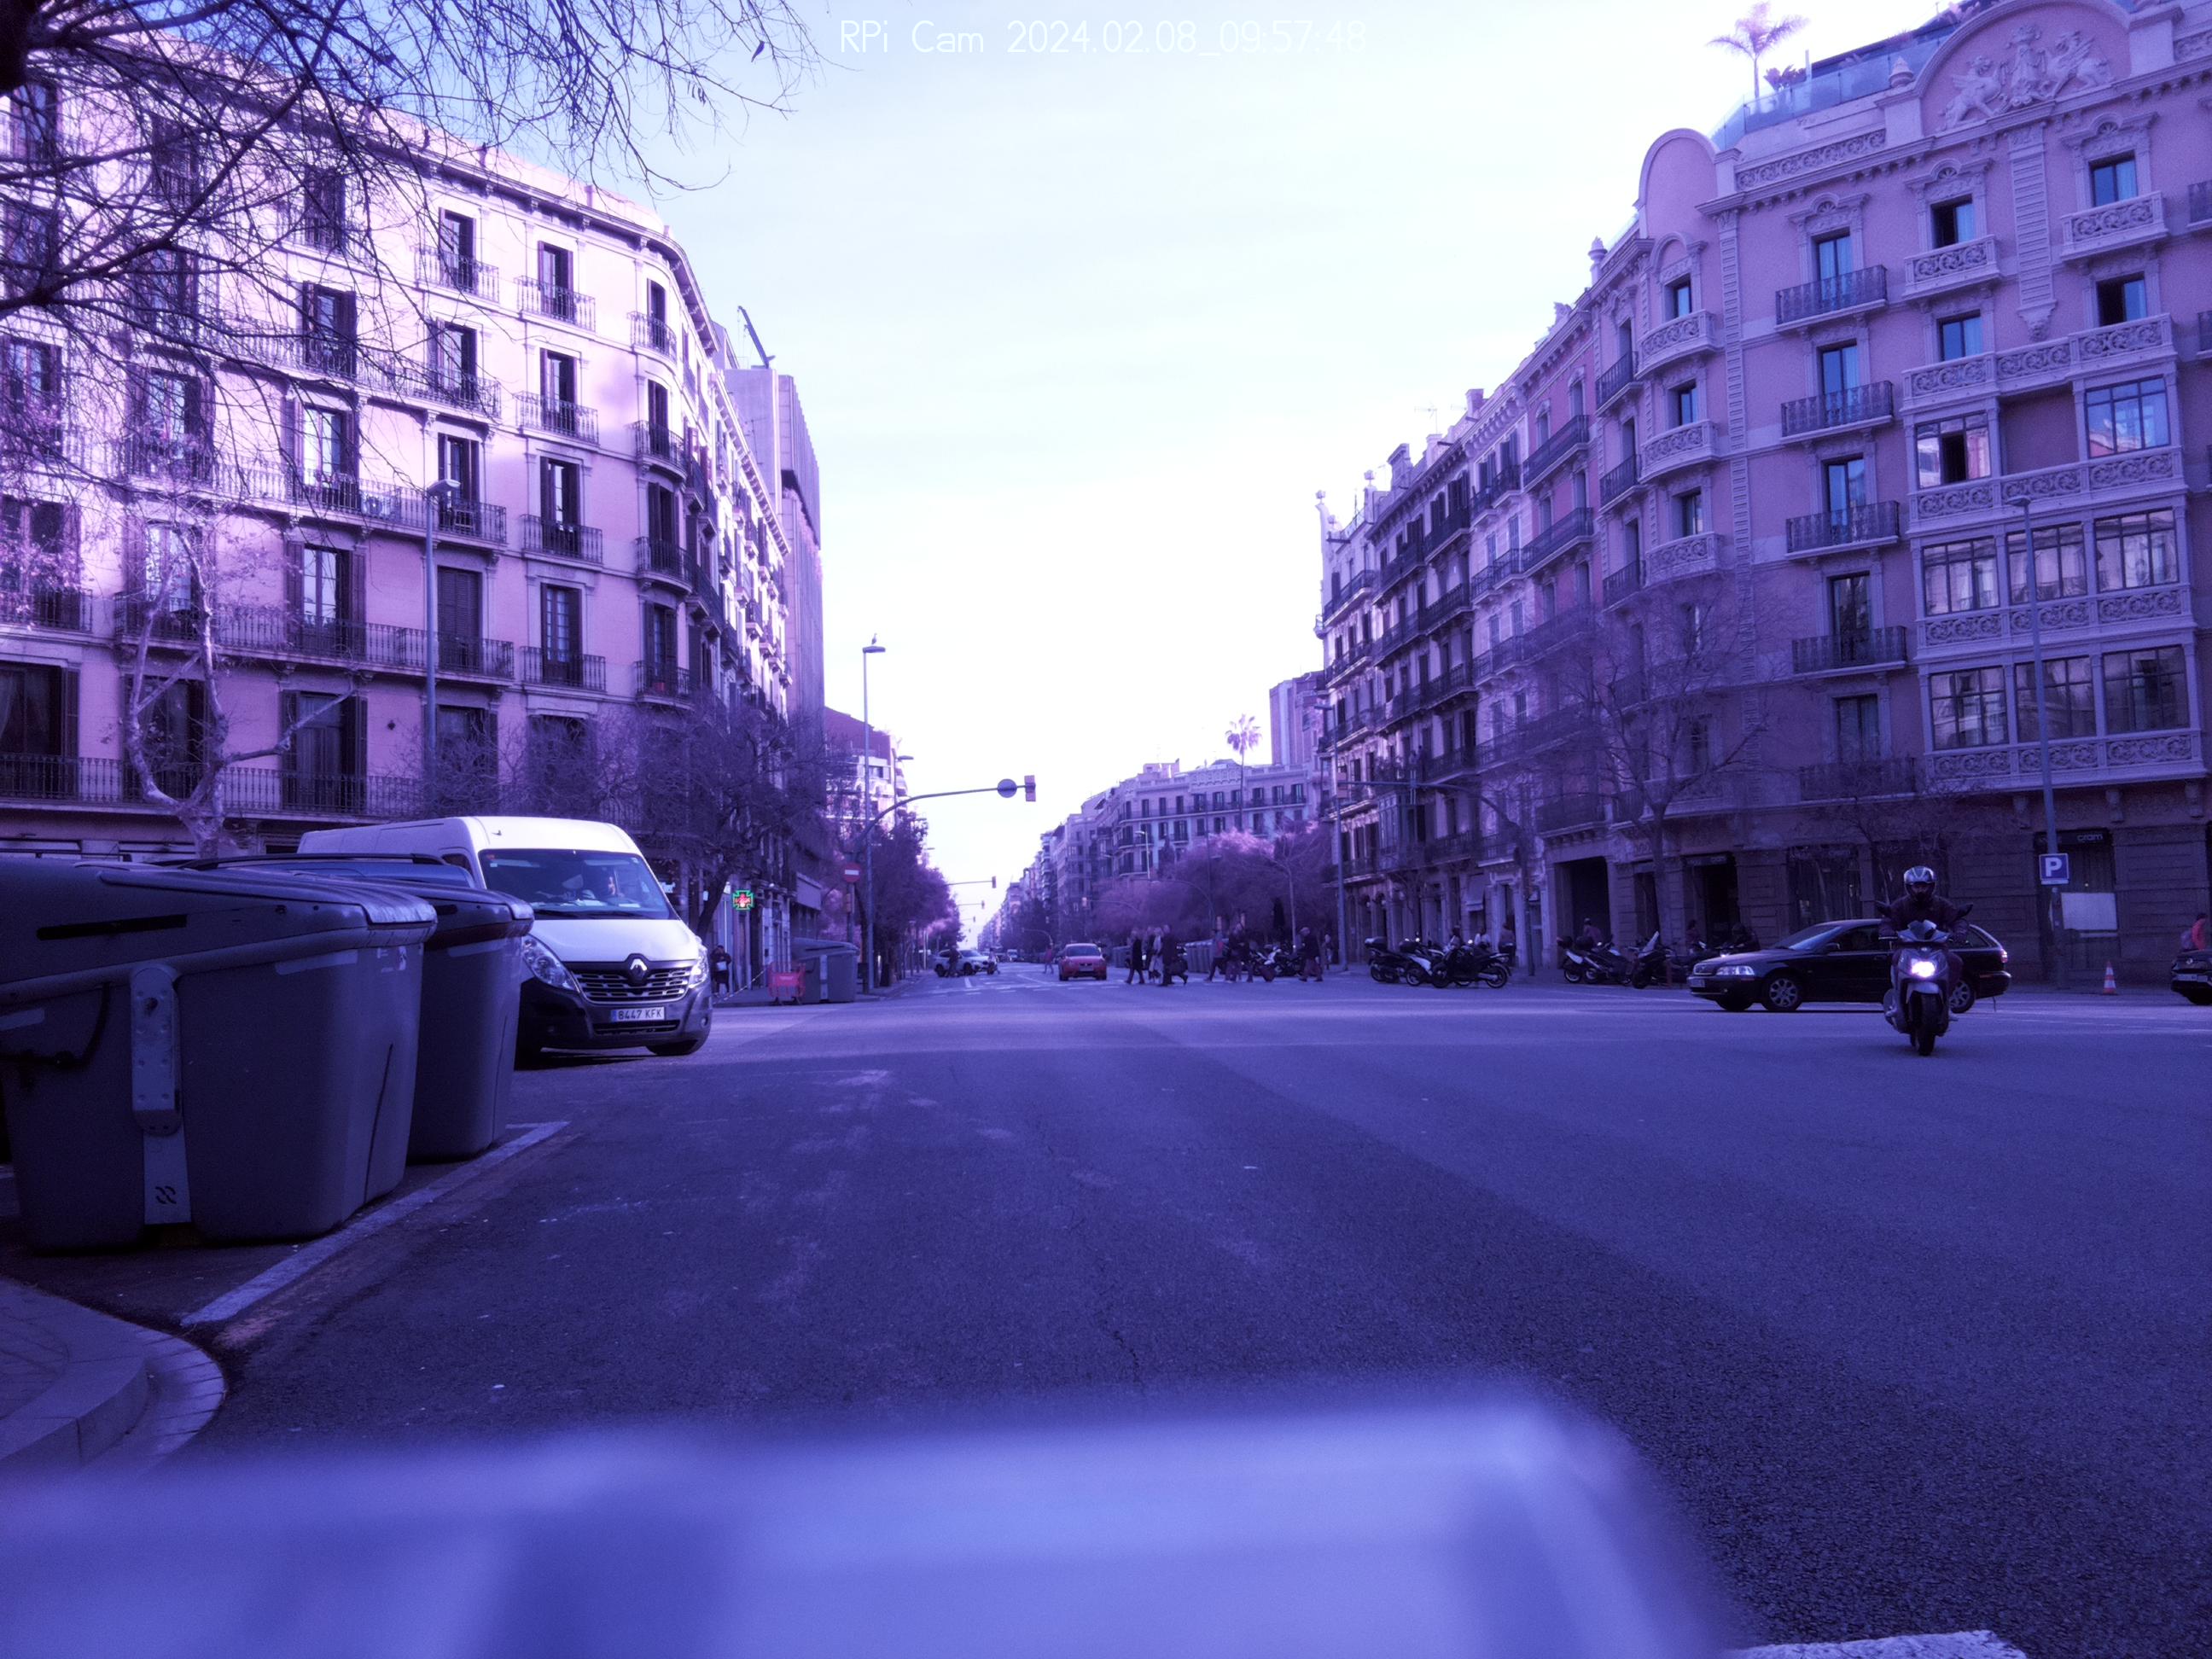
Light Level Analysis
.png)
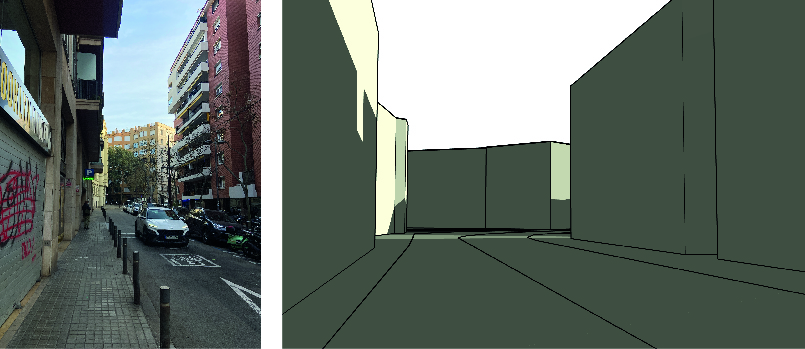
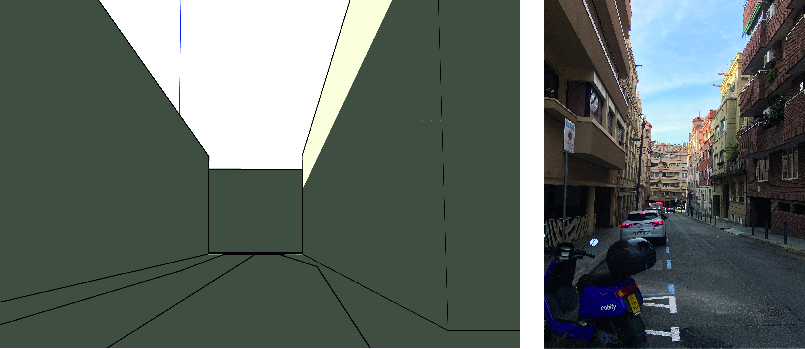
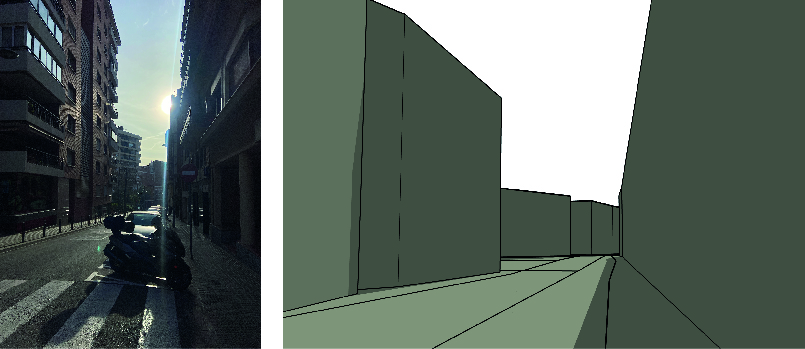
To corroborate the data we’d taken from the different neighbourhoods, we compared the images and light levels from each of the photos with a 3D simulation of each neighbourhood that we visited. Using a sun plugin in Google SketchUp that let us adjust the time of day and 3D models taken from CAD mapper (which is a website that allows you to download a free model of a square kilometre of an area of a city), we could pan the virtual sun over the same streets that we’d visited in real life to line up the shadows with what we were seeing in the photos. Helping us to corroborate our first-hand data with second-hand data ~ Which is an amazing feature and a really cool thing to see in real-time!
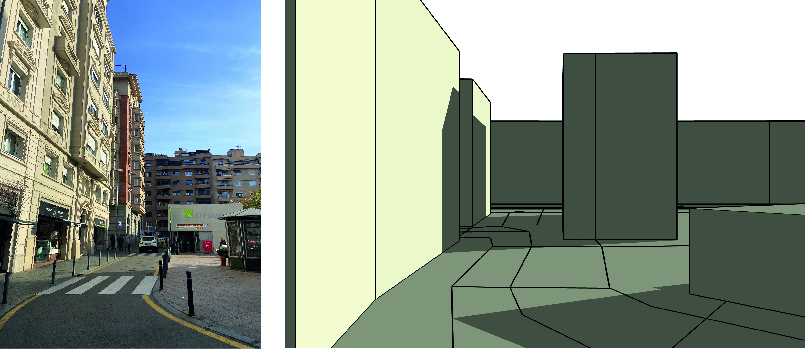
We were able to create a series of routes throughout the city that allowed you to navigate in a way that you could always be exposed to the sunshine on your morning commute to help you feel more connected and more awake. This was highlighted a unique insight, each different neighbourhood has different levels of sunlight exposure, for instance, Eixample has a very different level of sunlight exposure to Raval, because of the size and width of the streets, which is probably contributes to the vast price difference for homes in these neighbourhoods.
It was cool to see how we could take existing first data that was open and freely available compared to data we collected ourselves to get a whole cohesive picture that we could then use to create a speculative product or service that could be developed in the future.
HackMD For this assignment we alo created a HackMD document that details our entire development process, from research to implementation. If you are curious about how exactly we went about doing this project, click the button below 👇
Final Thoughts, Key Takeaways, Follow-up Questions
I really enjoyed this module, and I’m glad we did it. The key takeaways that stood out to me is:
- Open data and information is available everywhere.
- The difficulty — but also the reward —lies in taking that data and turning it into useful information.
- Because that data, once turned into information, is incredibly useful for specific applications.
- Pieces of information that are freely available can be turned into useful products and services.
But it is also important to always ask the question:
“Who should profit the most from those products and services? Is it you, the designer, who’s used all that information, or should it also be the people who passed the data and turned it into useful information?”
I think this project was a really fun undertaking, and I hope in the future is something that maybe I could explore further in a different intervention because I can definitely see myself wanting to navigate my own city in a way that isn’t just the most efficient way to get from point A to Point B.